How I Designed SenseNet’s 0→1 Wildfire Monitoring Dashboard to Turn Complex Data Into Clear, Actionable Tools for Emergency Teams
SenseNet’s wildfire detection platform equips emergency teams and municipalities in British Columbia with real-time, AI-powered insights into wildfire behavior across vast, high-risk areas. I was responsible for designing the entire dashboard system from the ground up, crafting a fast, accessible, and data-rich interface where clarity and usability directly support emergency response.
Impact:
Frontline Adoption
Trusted daily tool
Emergency Response
Faster, informed decisions
Situational Awareness
Real-time wildfire insights
Scalability
0→1 system built for growth
My Role
I led the end-to-end design of this complex, data-intensive dashboard, defining user flows, structuring key interfaces, and designing clear, responsive layouts for both desktop and mobile. I translated real-time wildfire data into intuitive visualizations and actionable views, iterating based on feedback to ensure usability, speed, and clarity under emergency conditions.
Team
I worked closely with product owners, stakeholders, engineers, and data scientists in a cross-functional team. Throughout the project, I participated in collaborative workshops with the tech team, PM, and PO to align design decisions with technical constraints, data logic, and product goals.
SenseNet Inc. | Vancouver, British Columbia, Canada
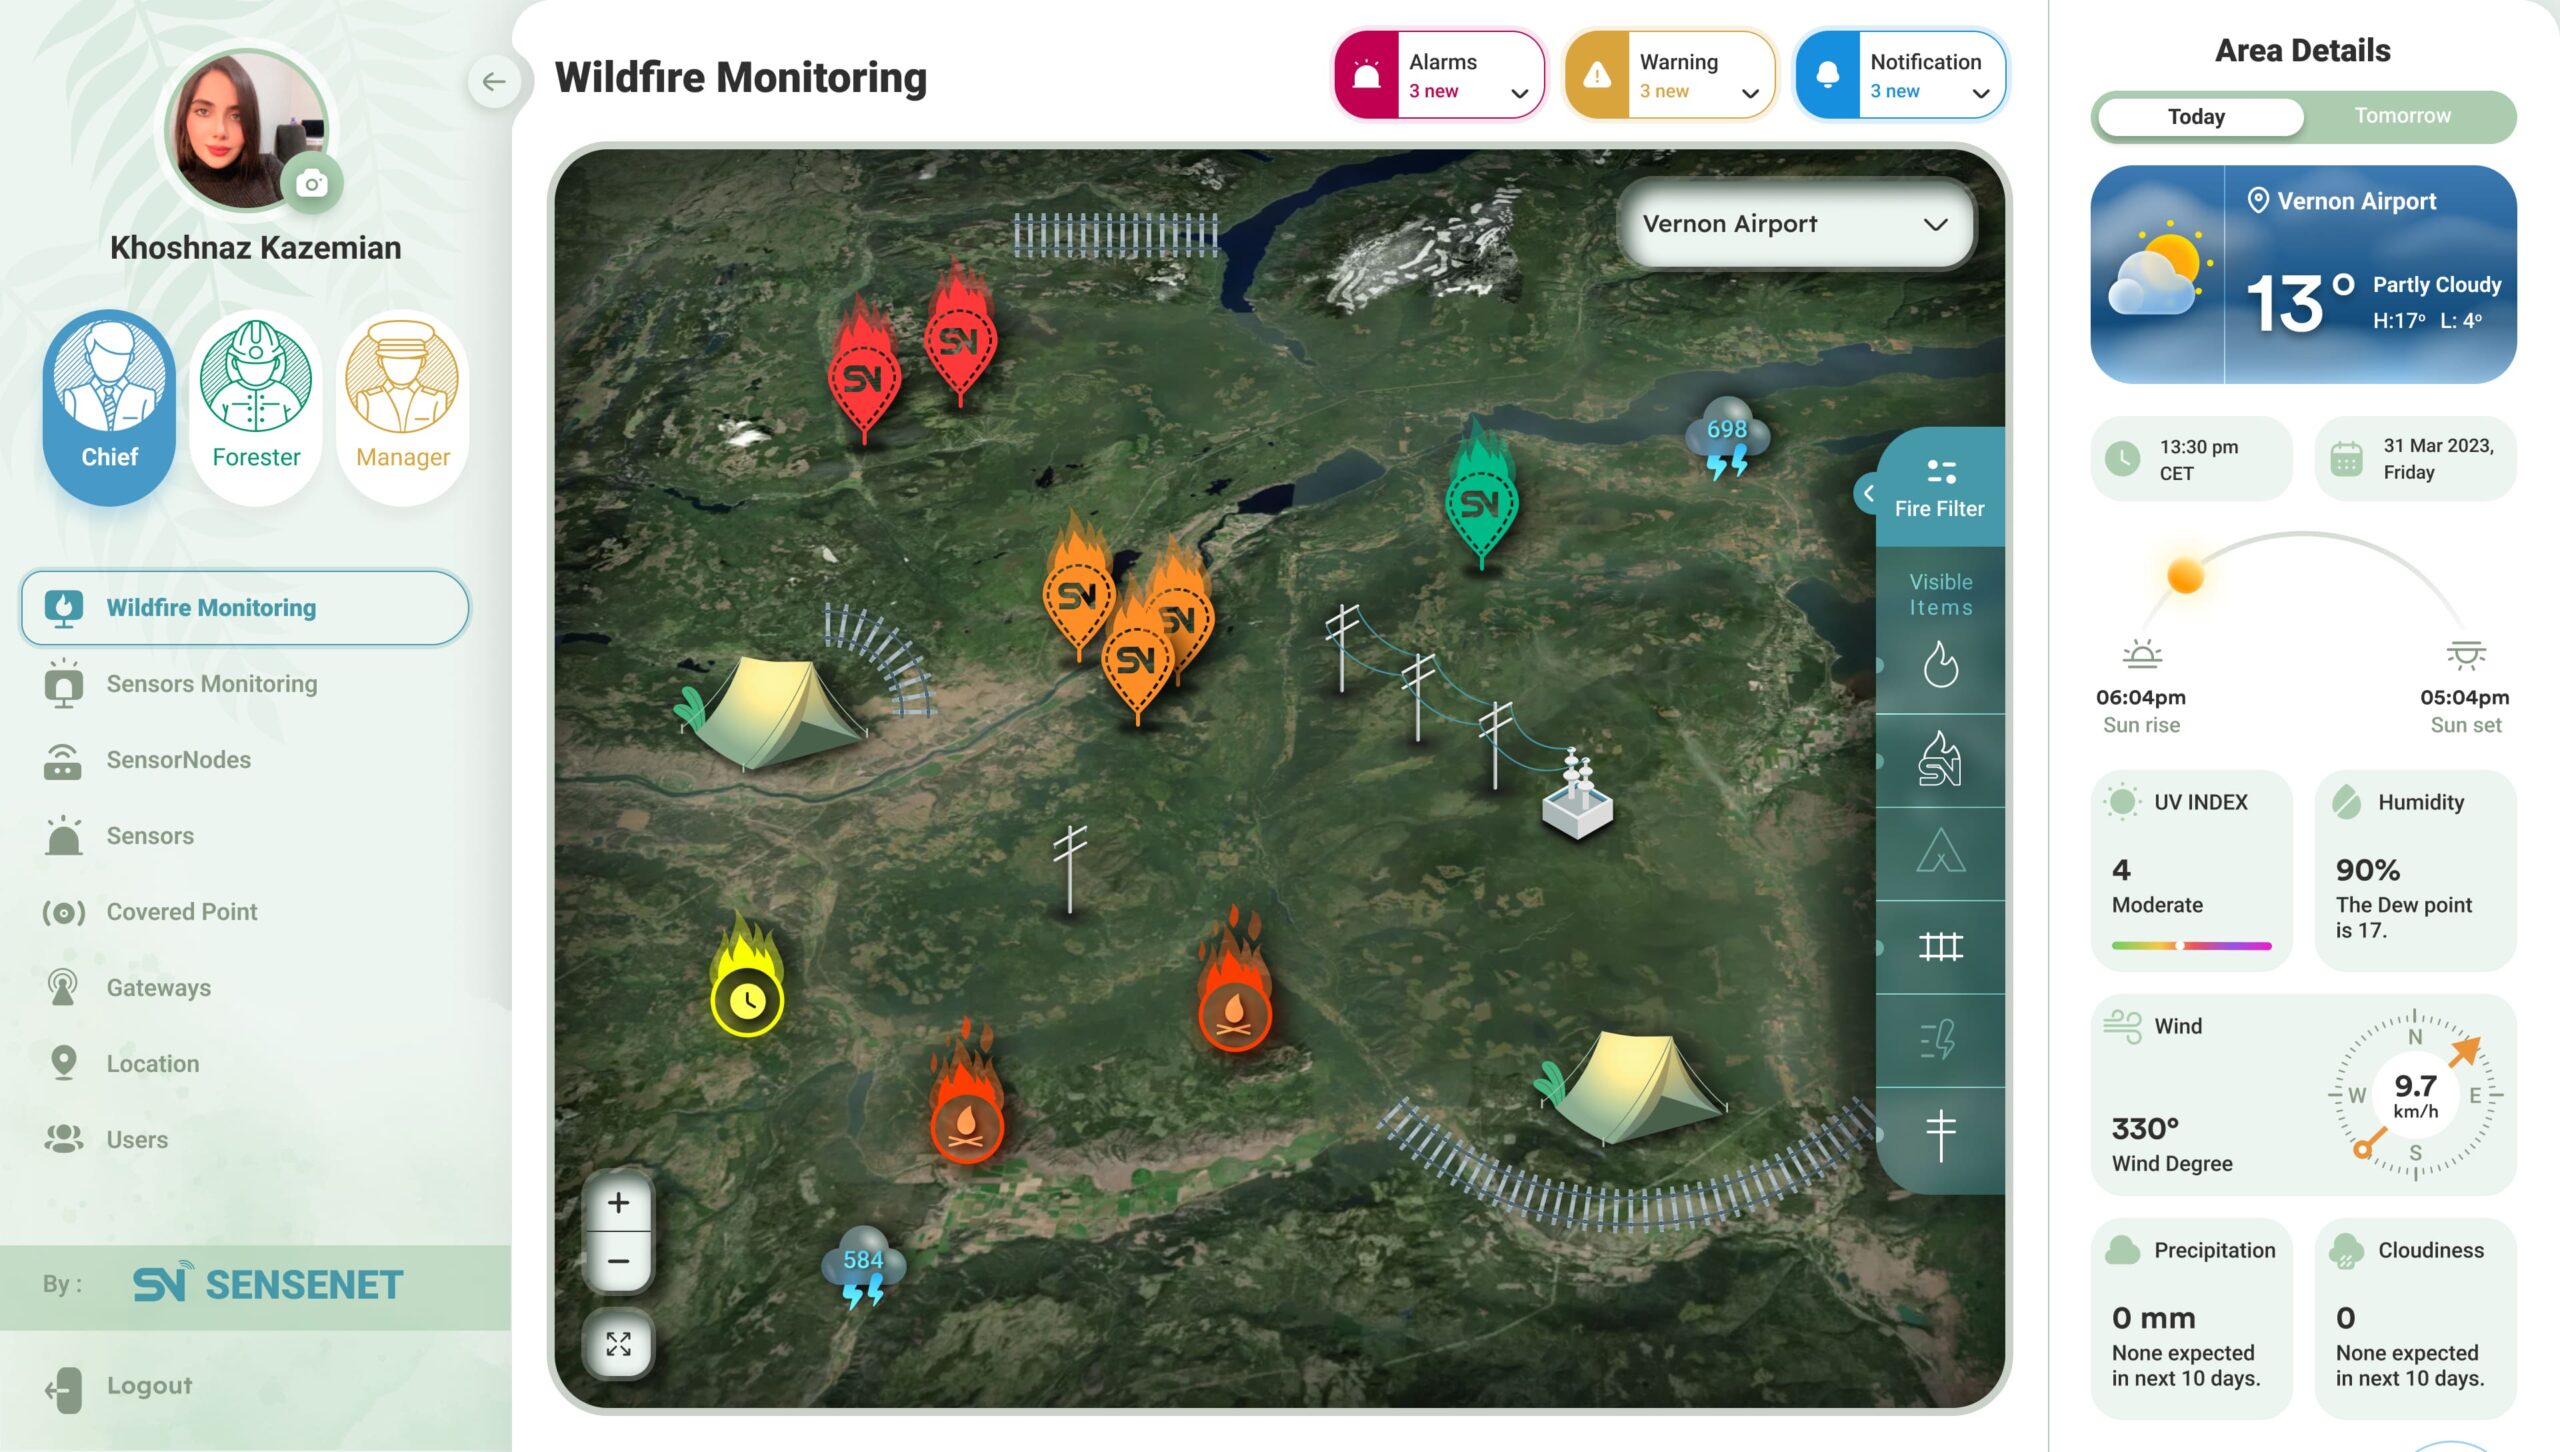
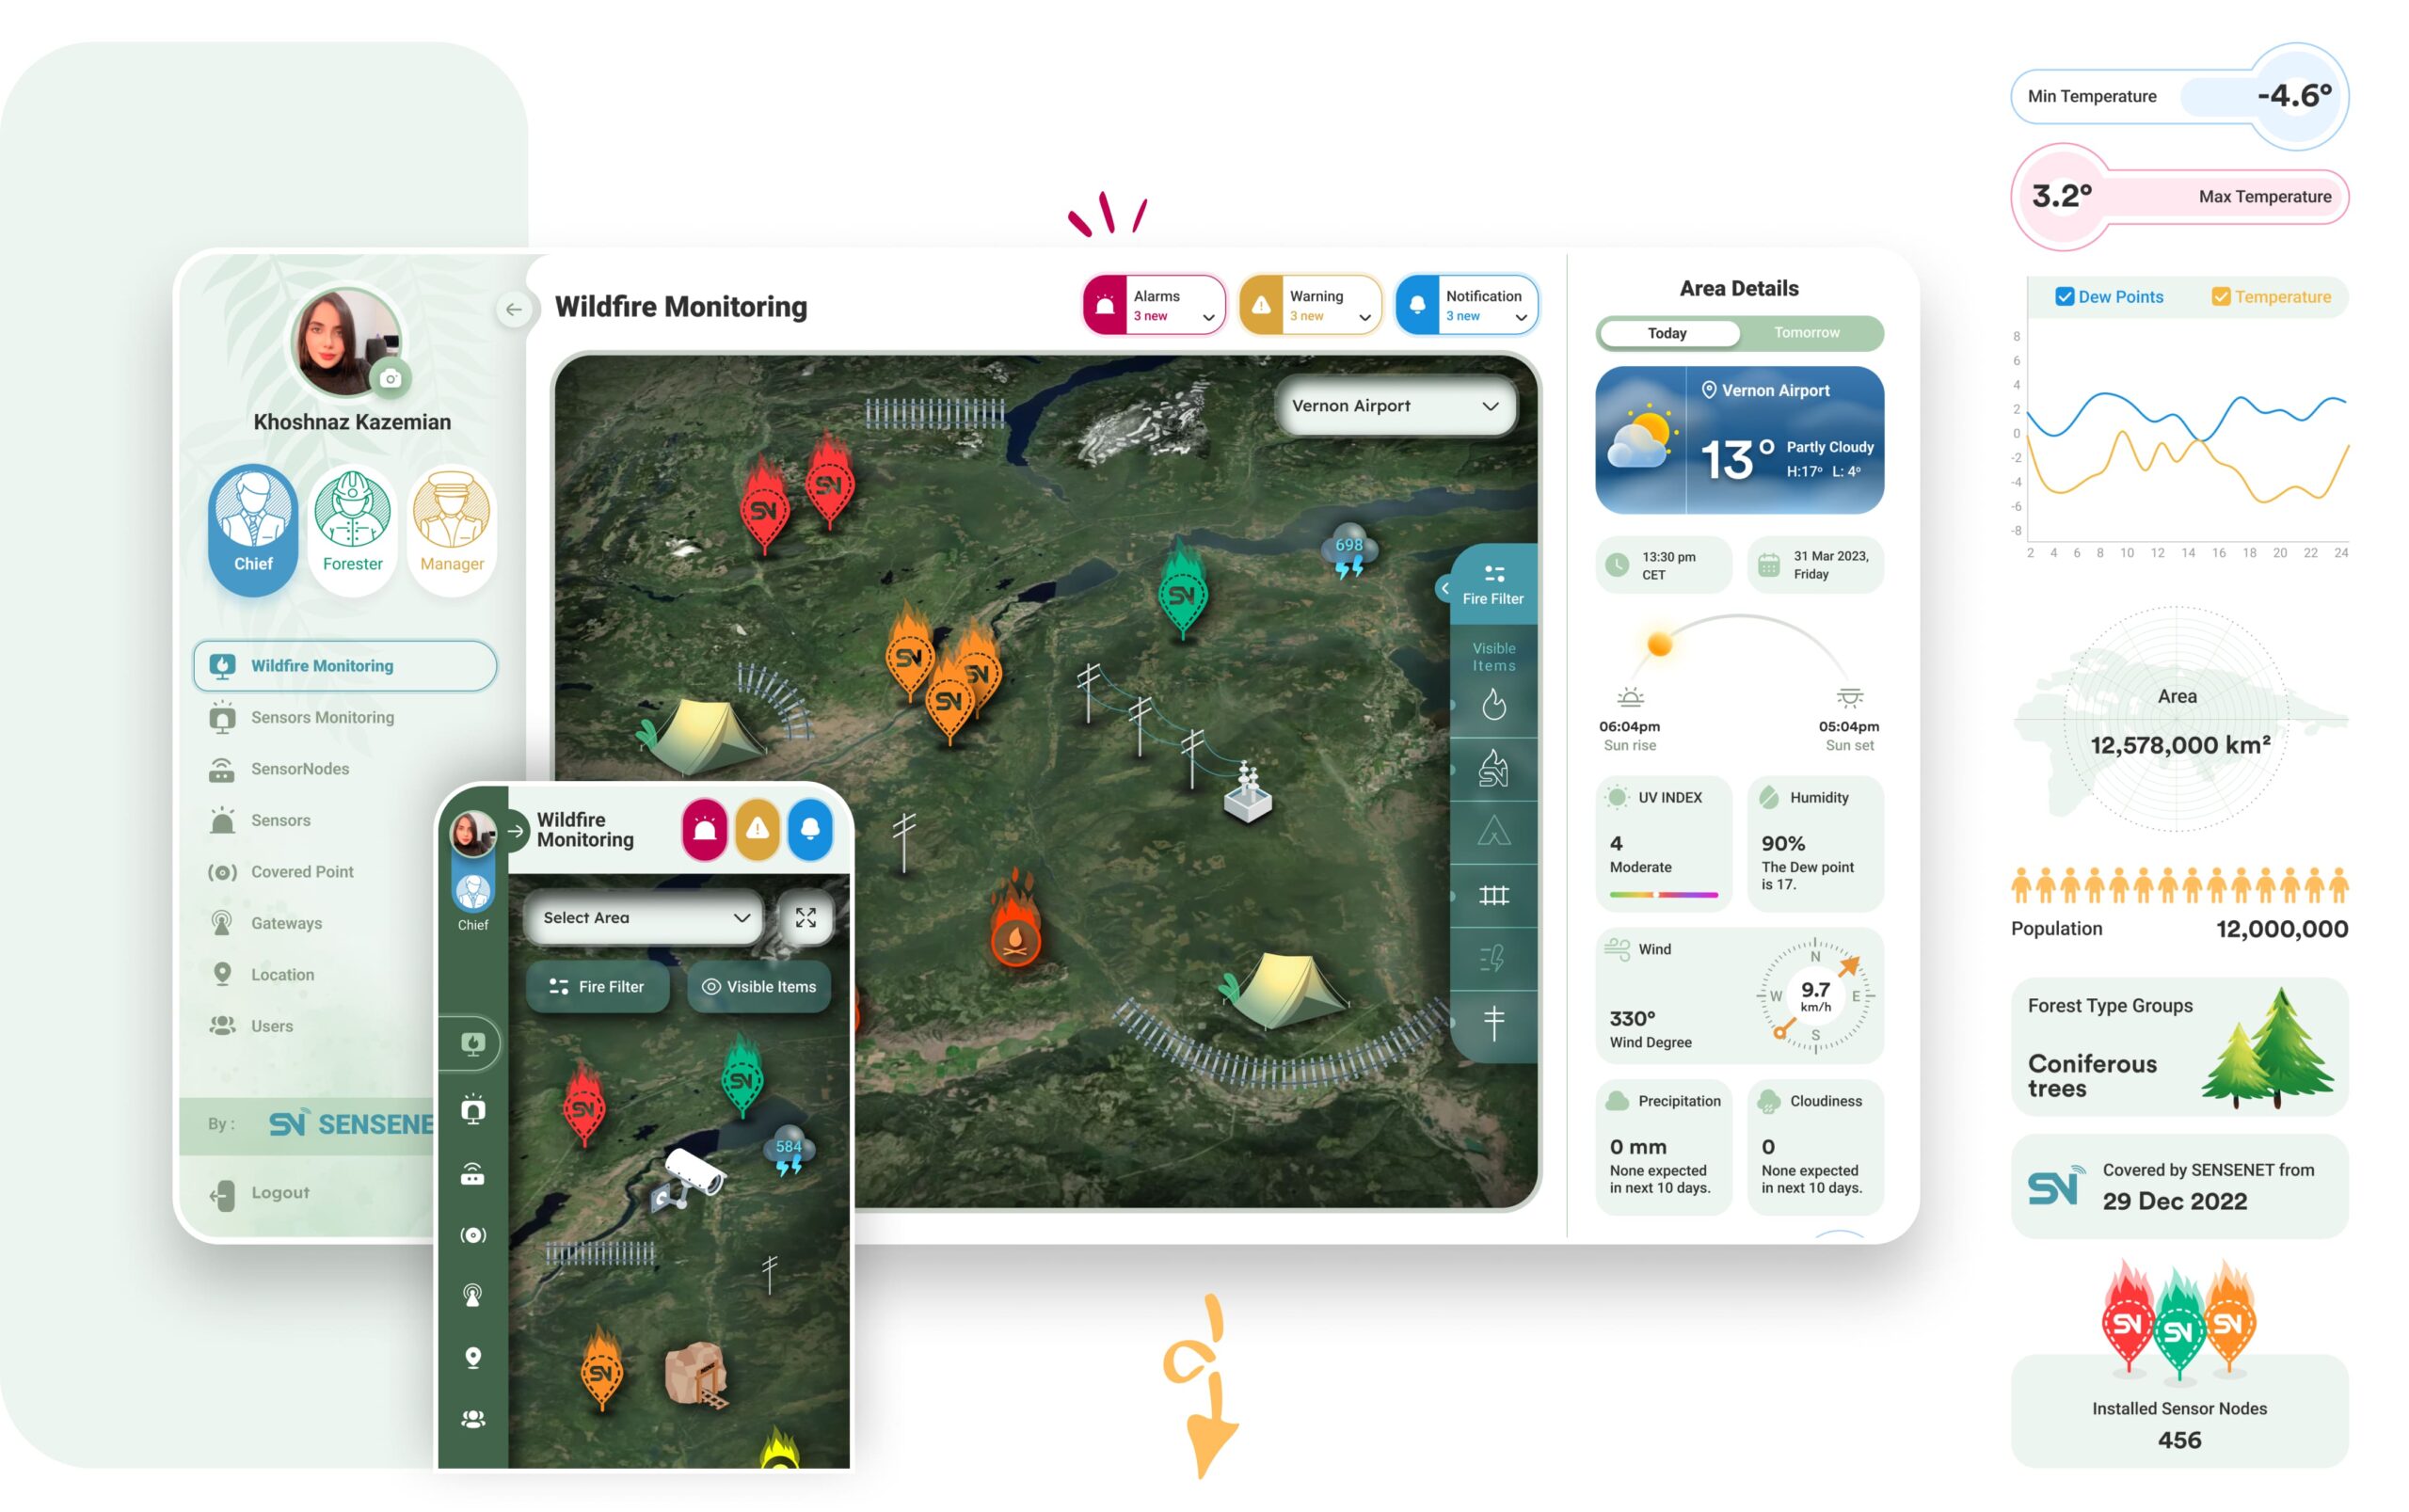
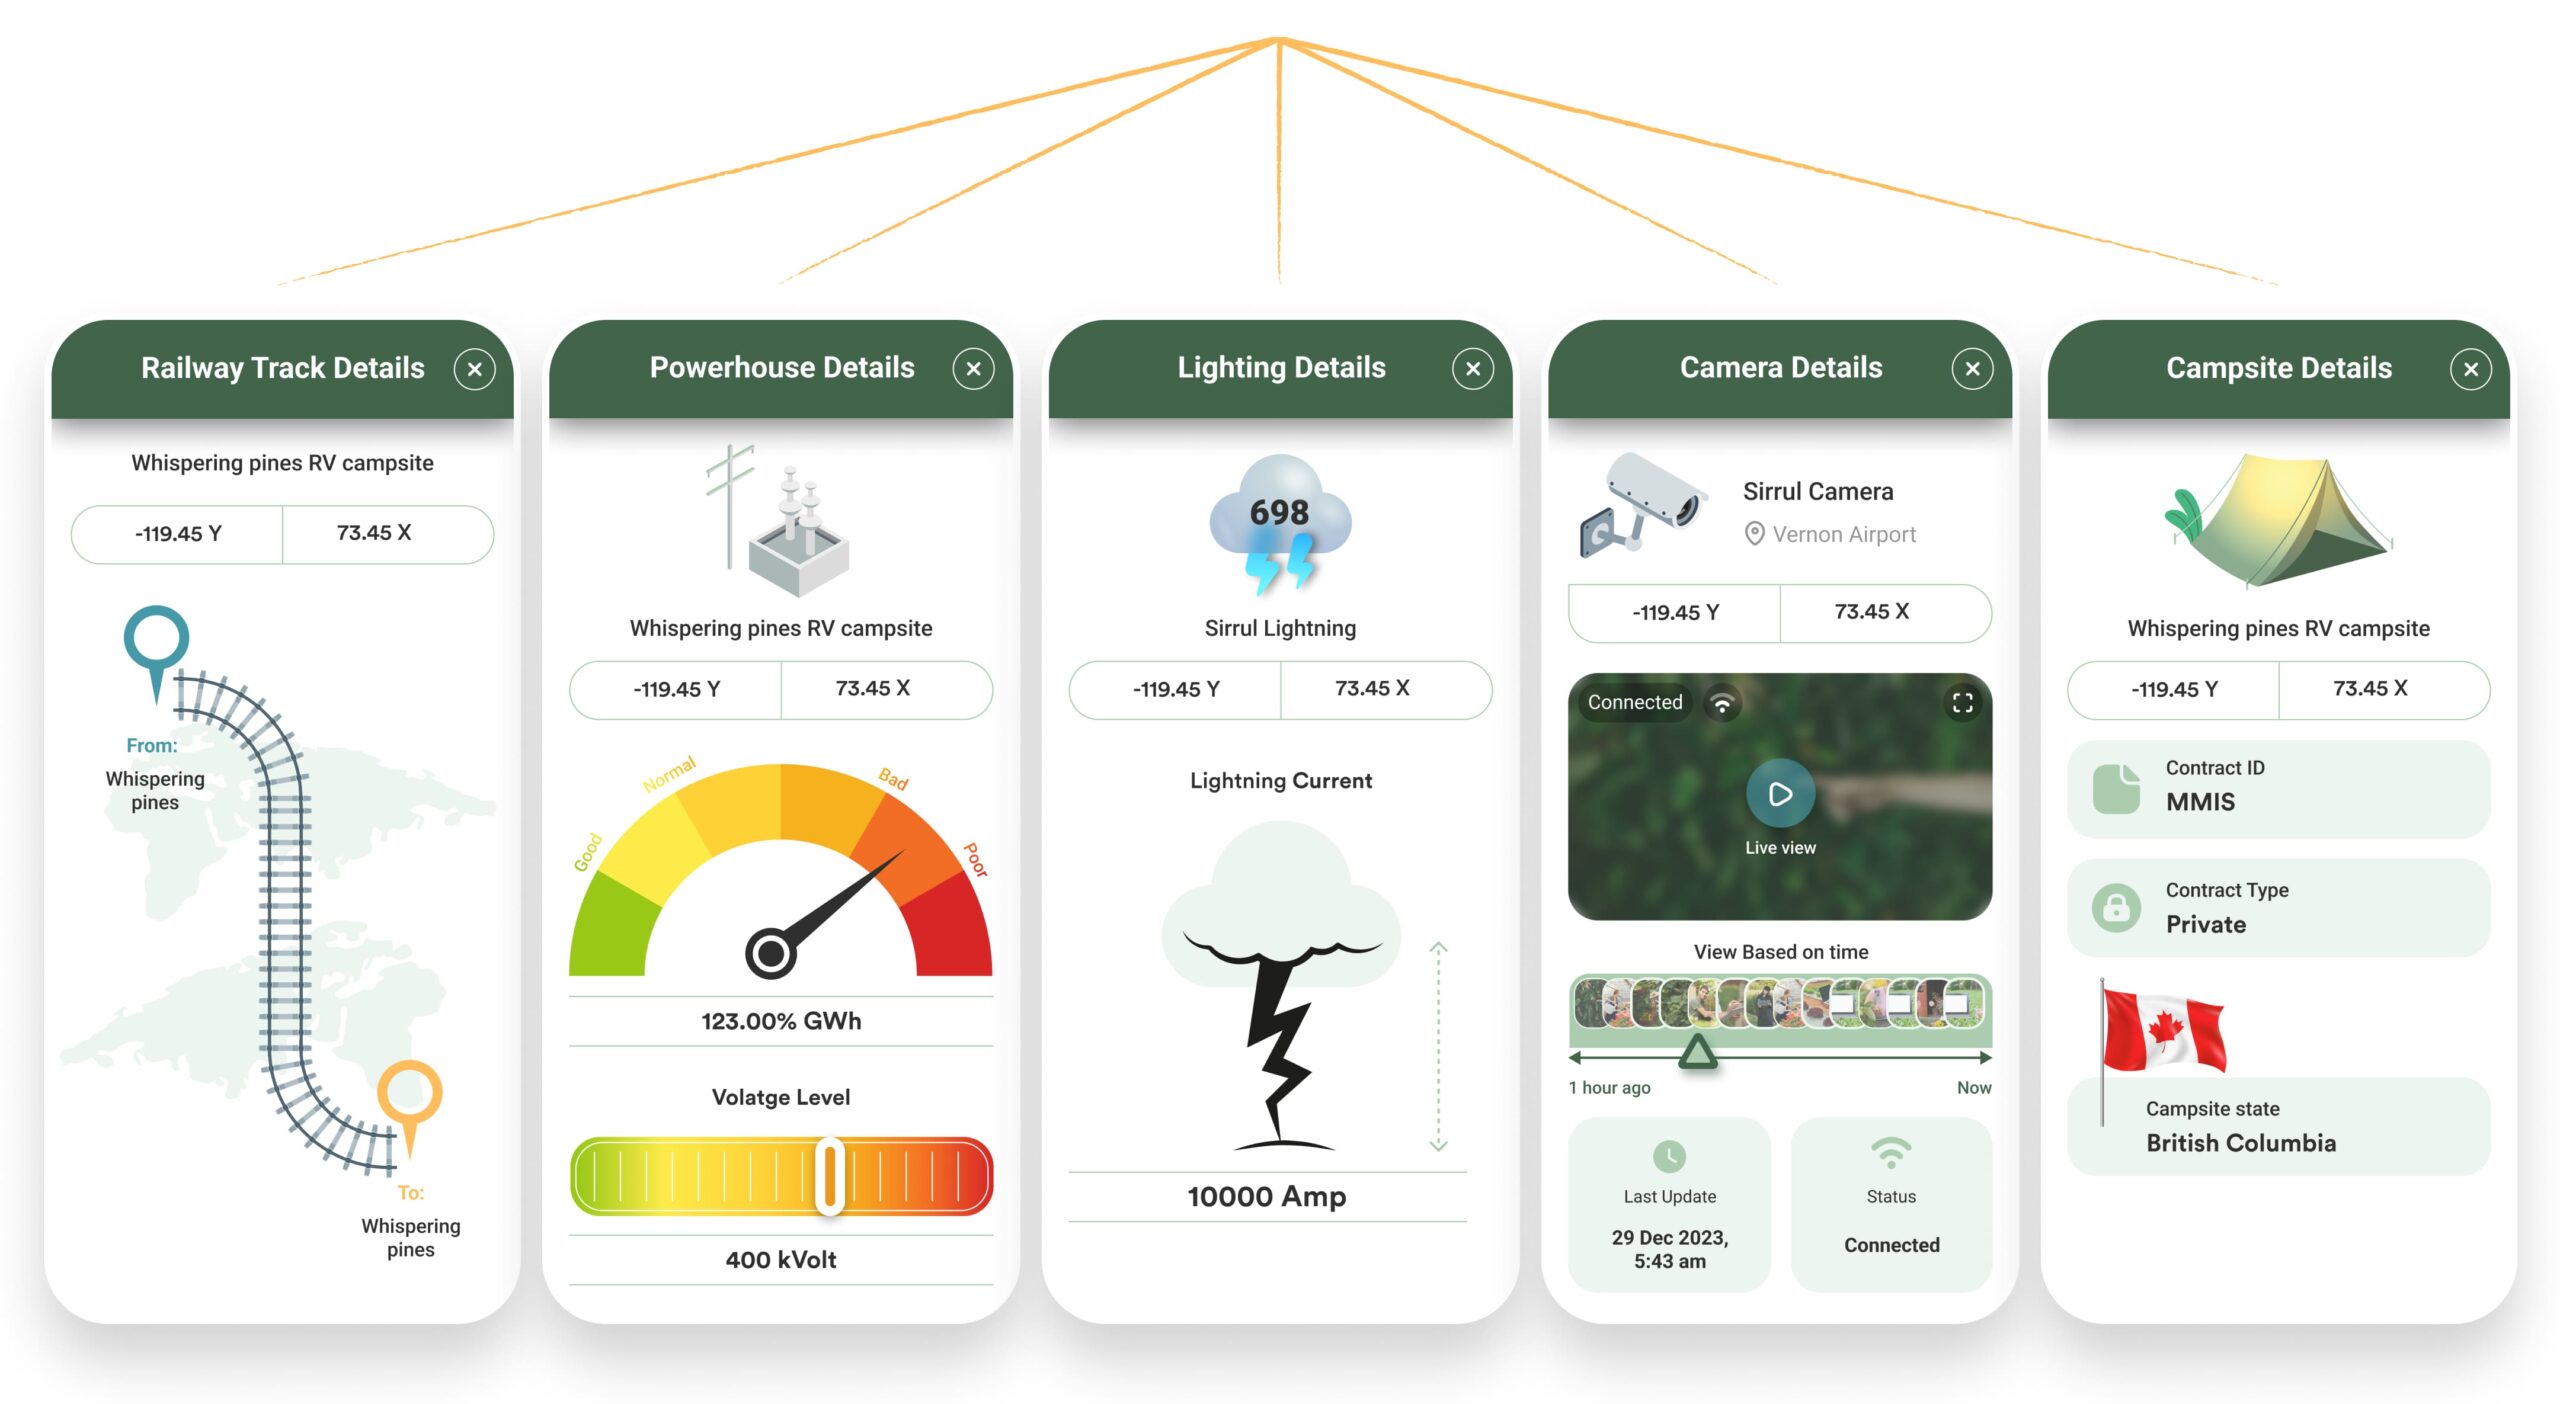
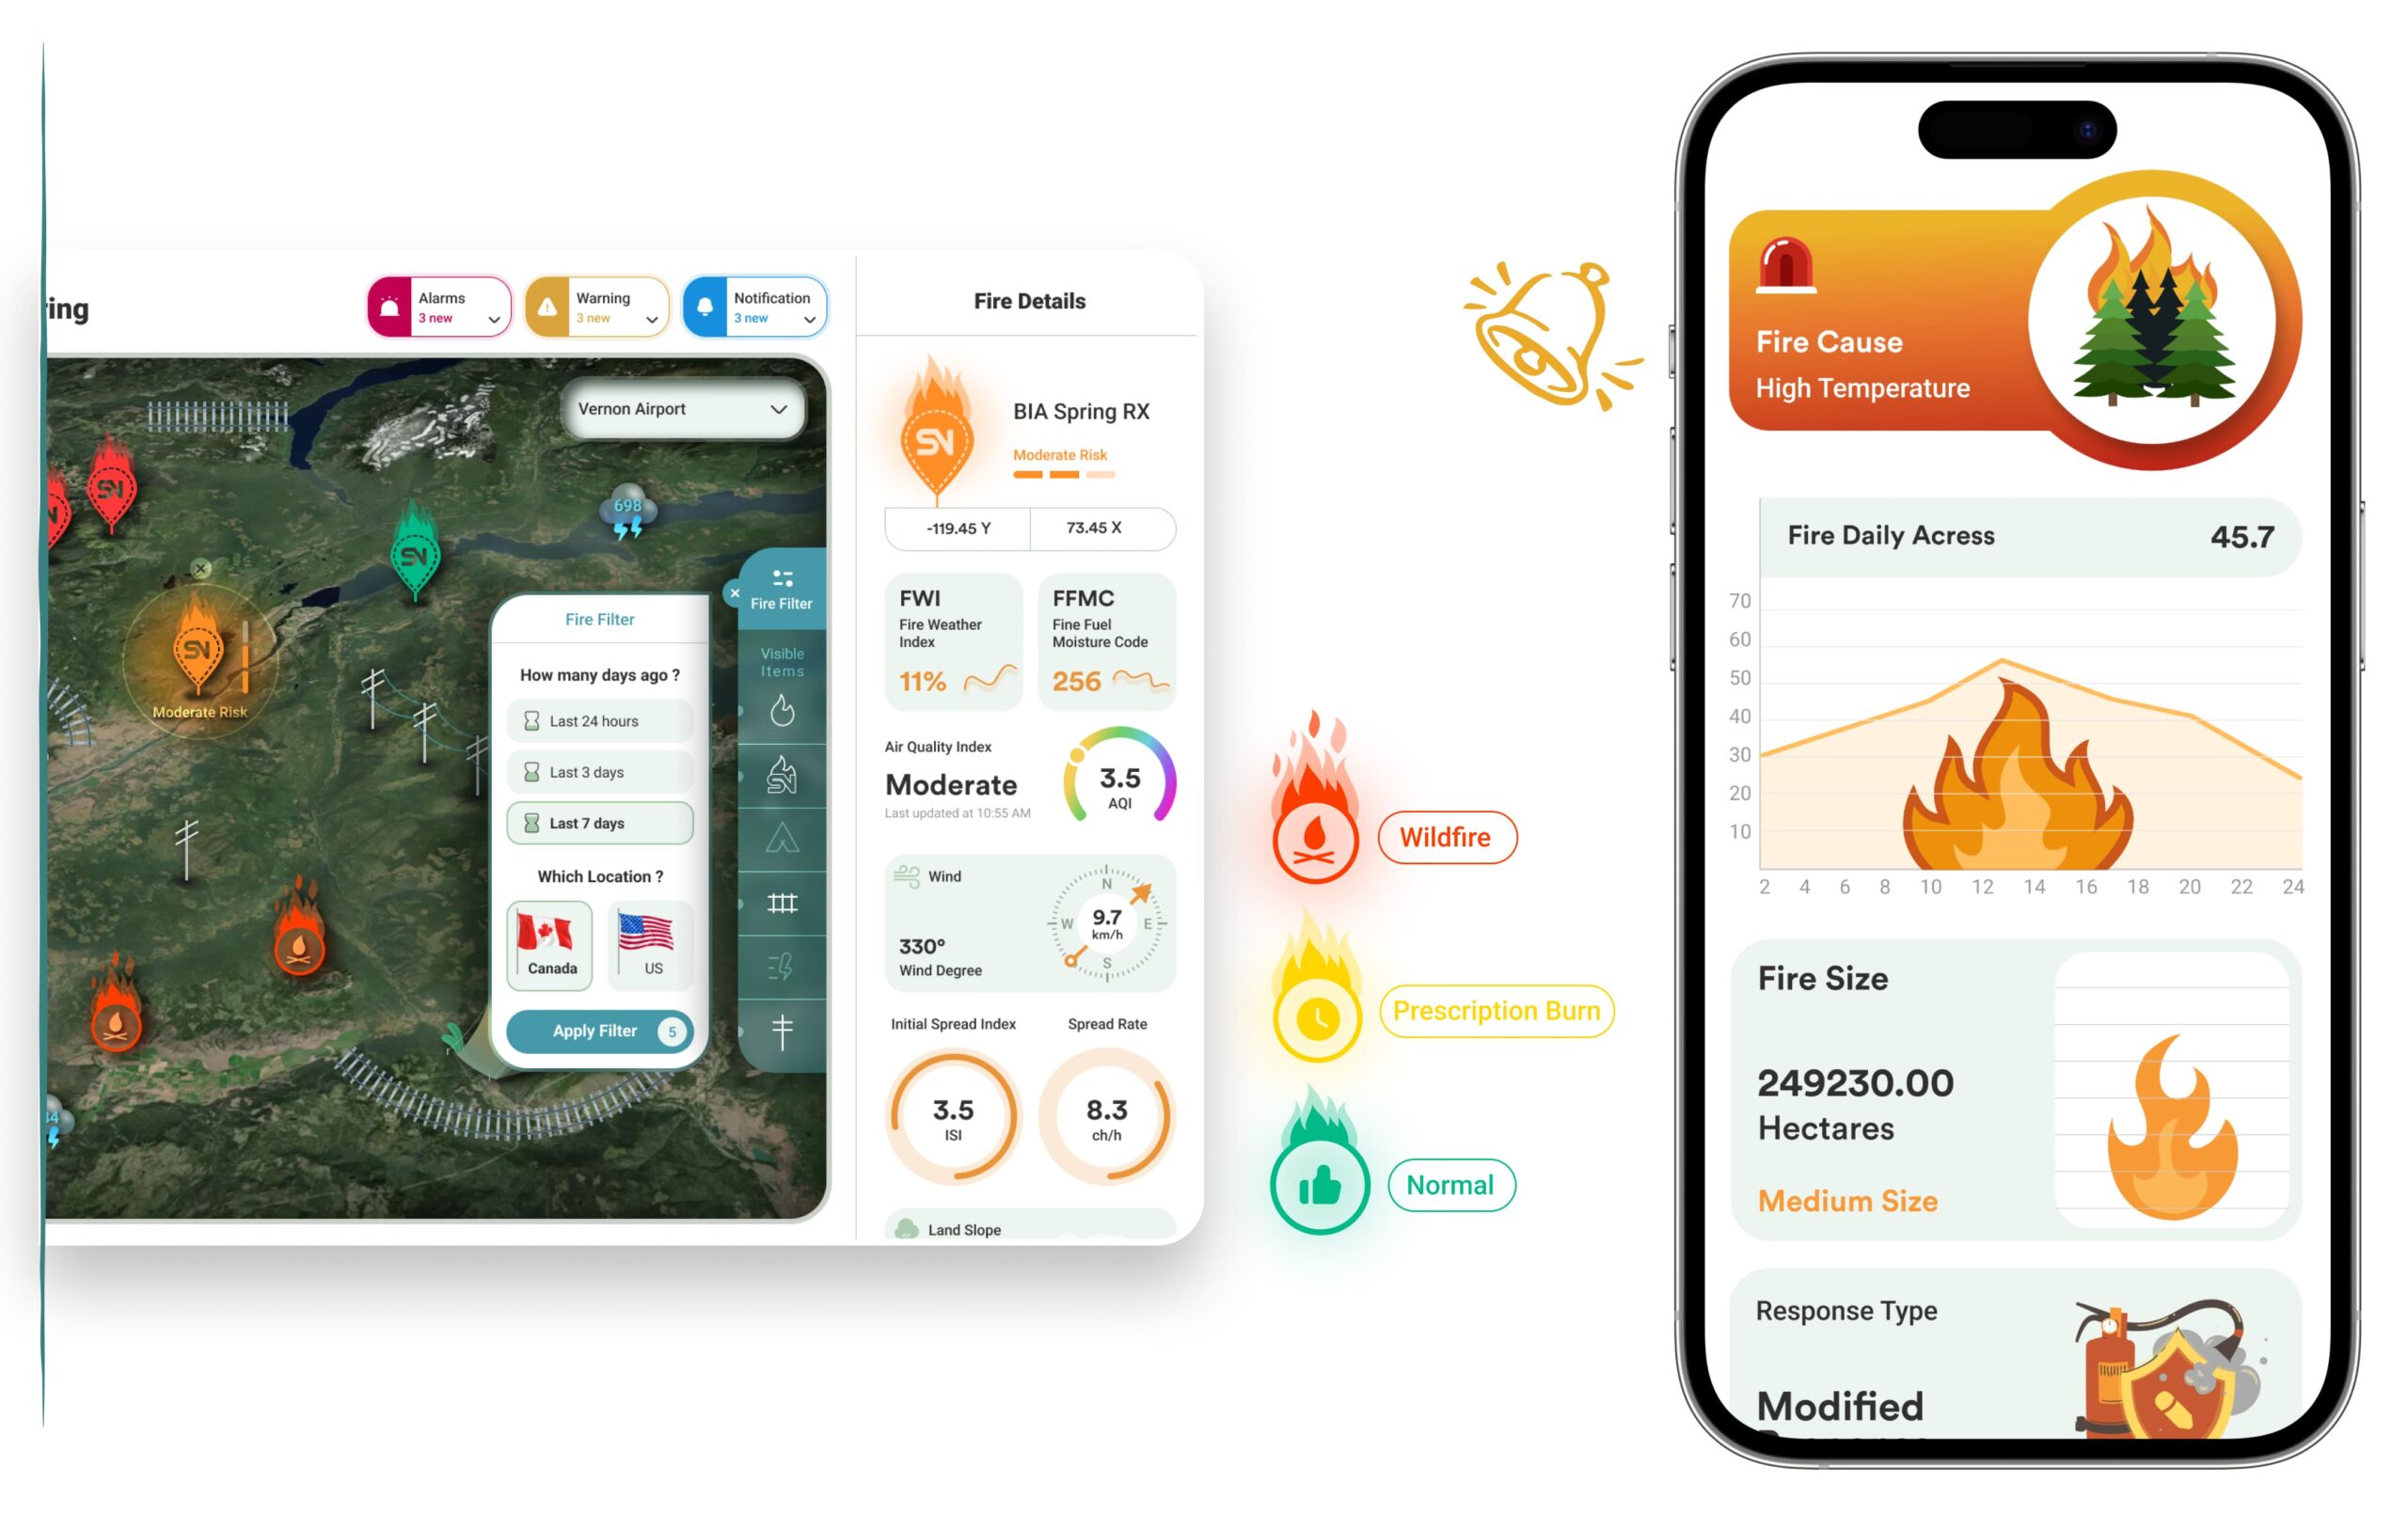
Real-Time Wildfire Risk Awareness
Mapped wildfire threats across forests, railways, and campsites with clear icons and alerts, enabling quick interpretation and faster decisions.
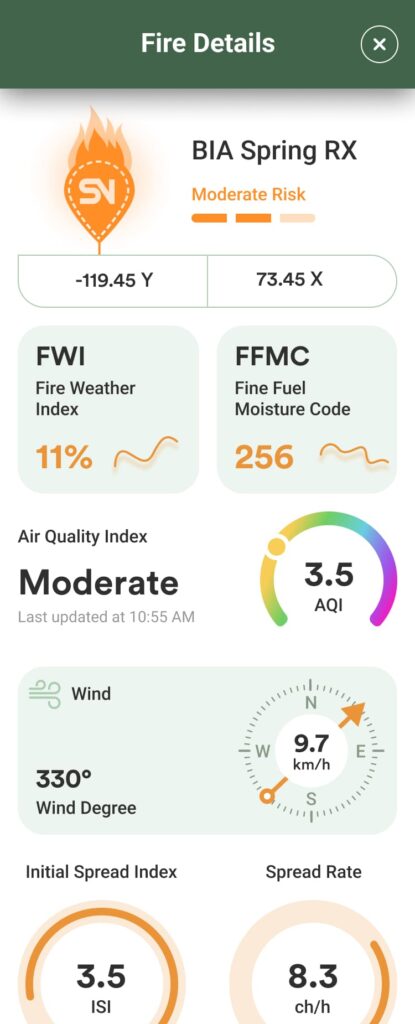
Clear Fire Insights for Faster Action
Color-coded indicators and simplified layouts highlight fire type, cause, and threat level, reducing clicks and helping teams act quickly on critical data.
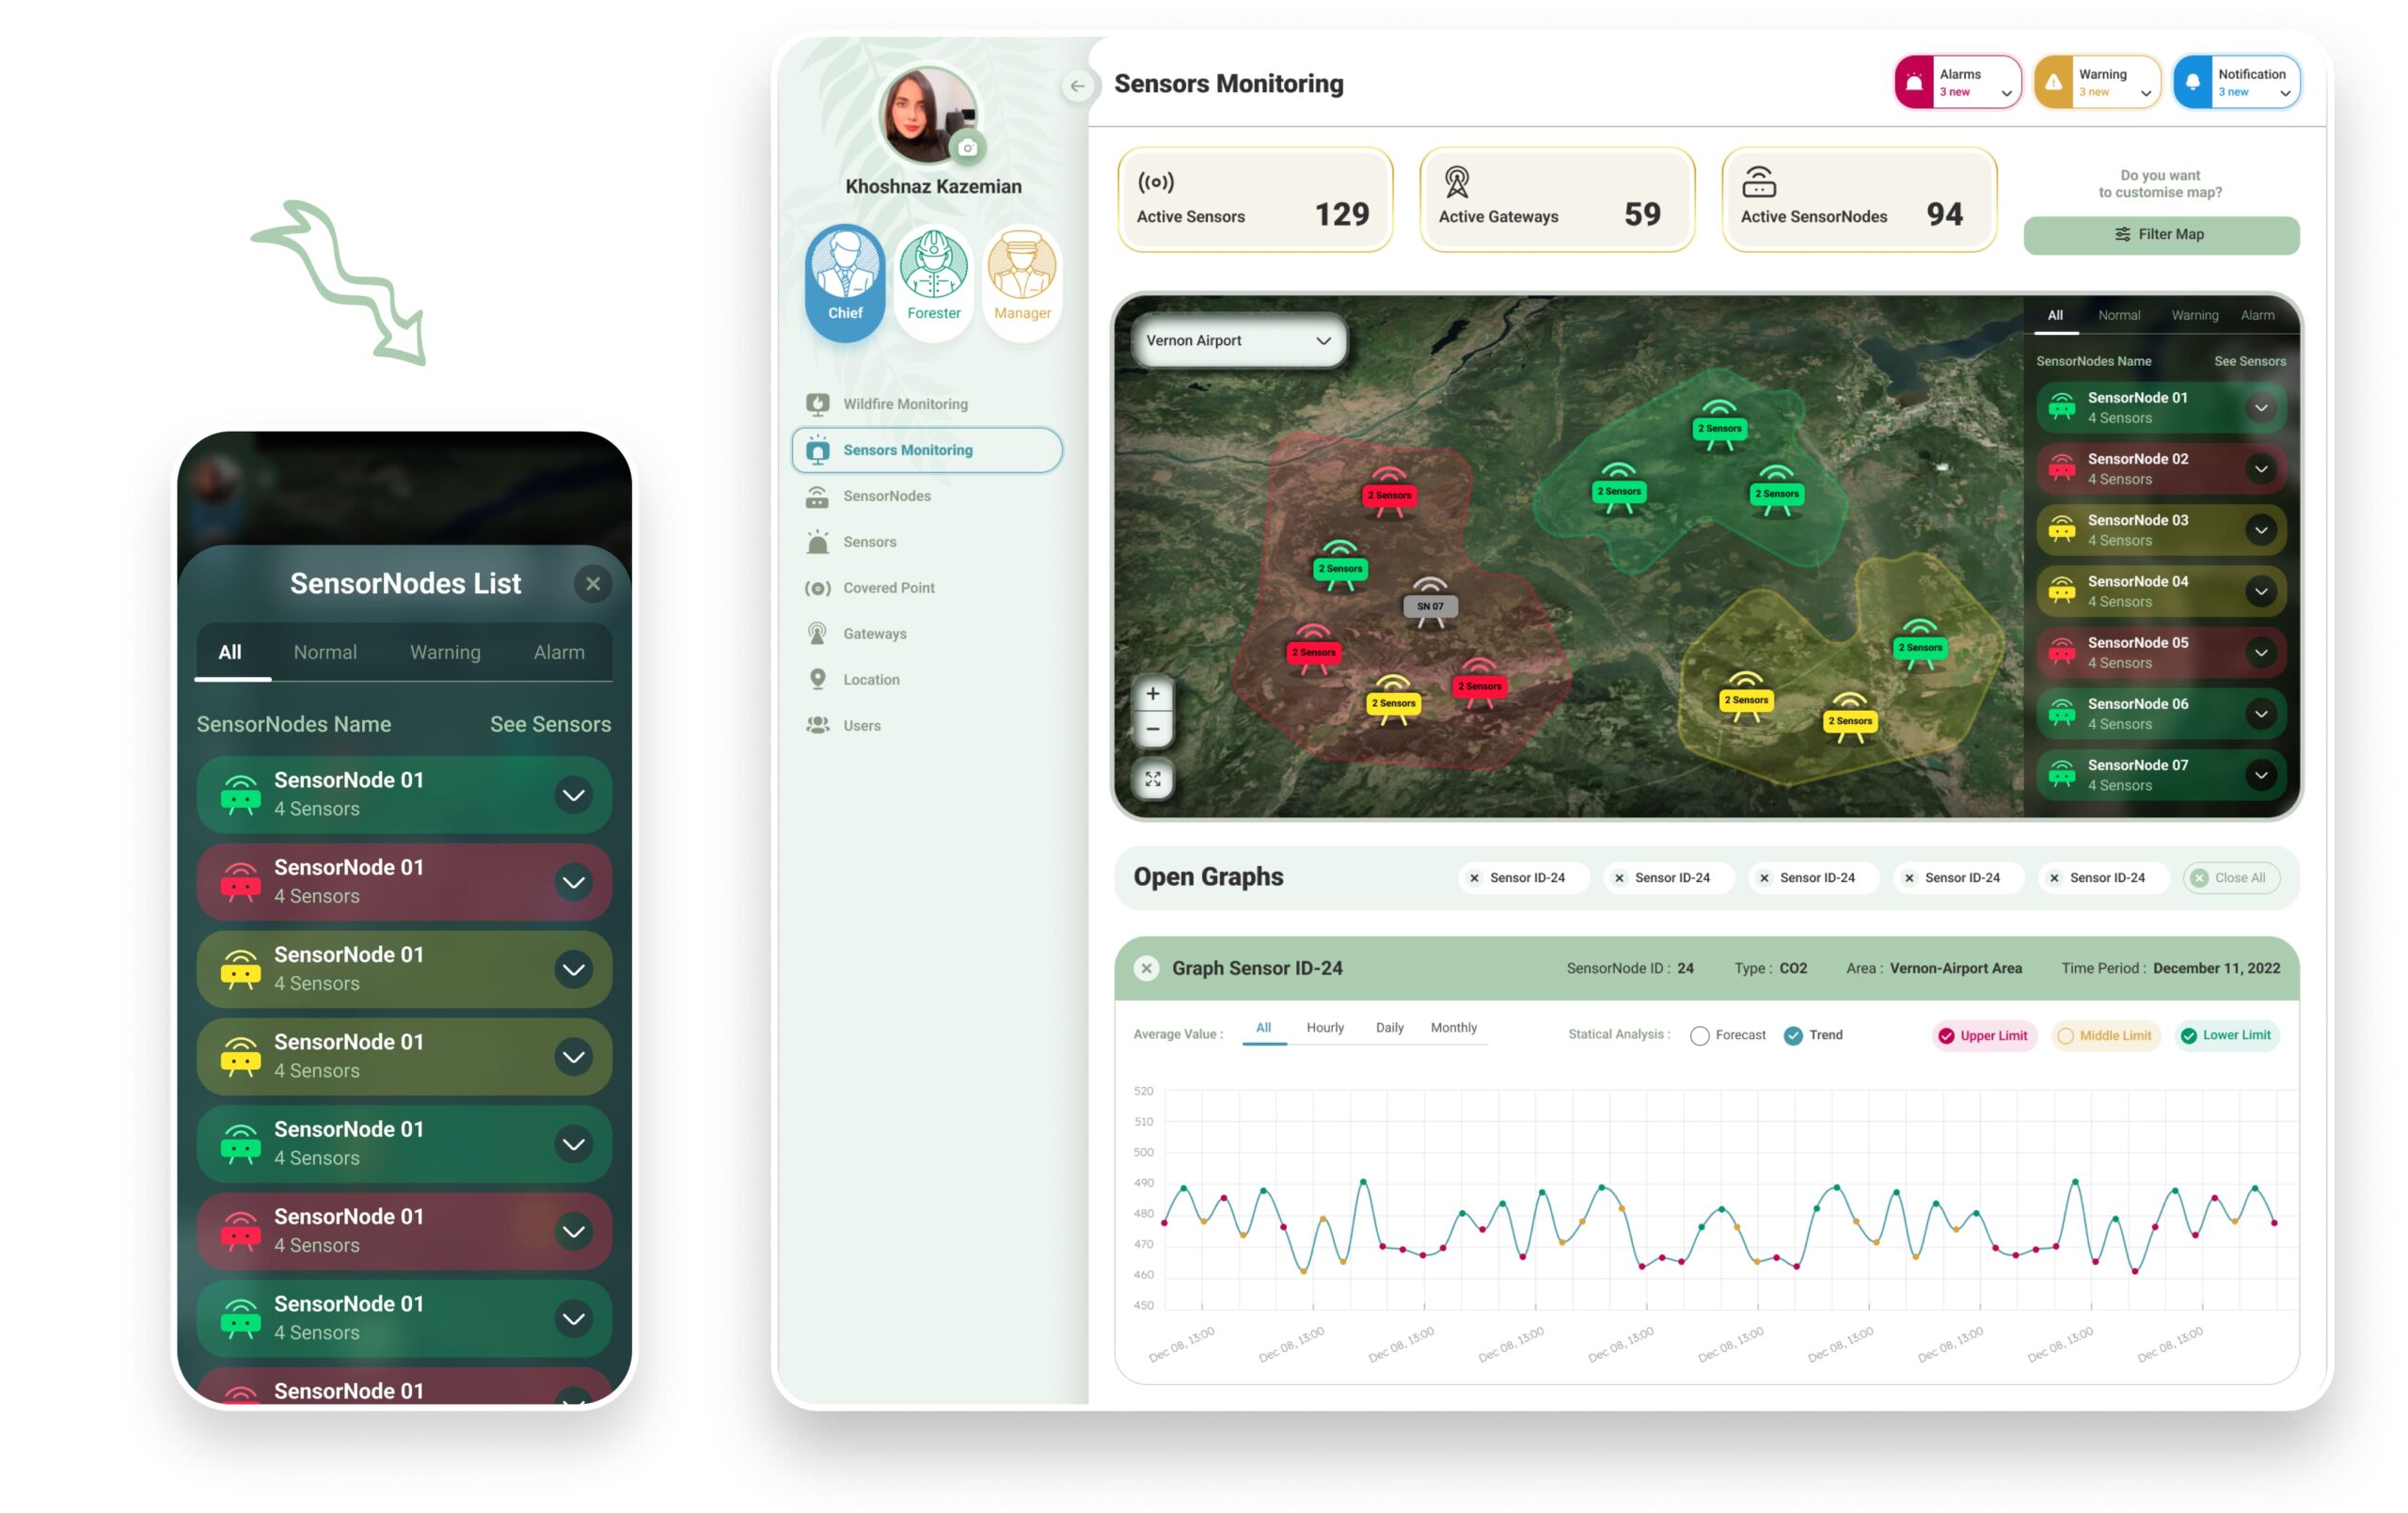
Real-Time Sensor Monitoring
Mapped sensors by location with one-click access to graphs, helping teams track device performance and spot issues instantly.
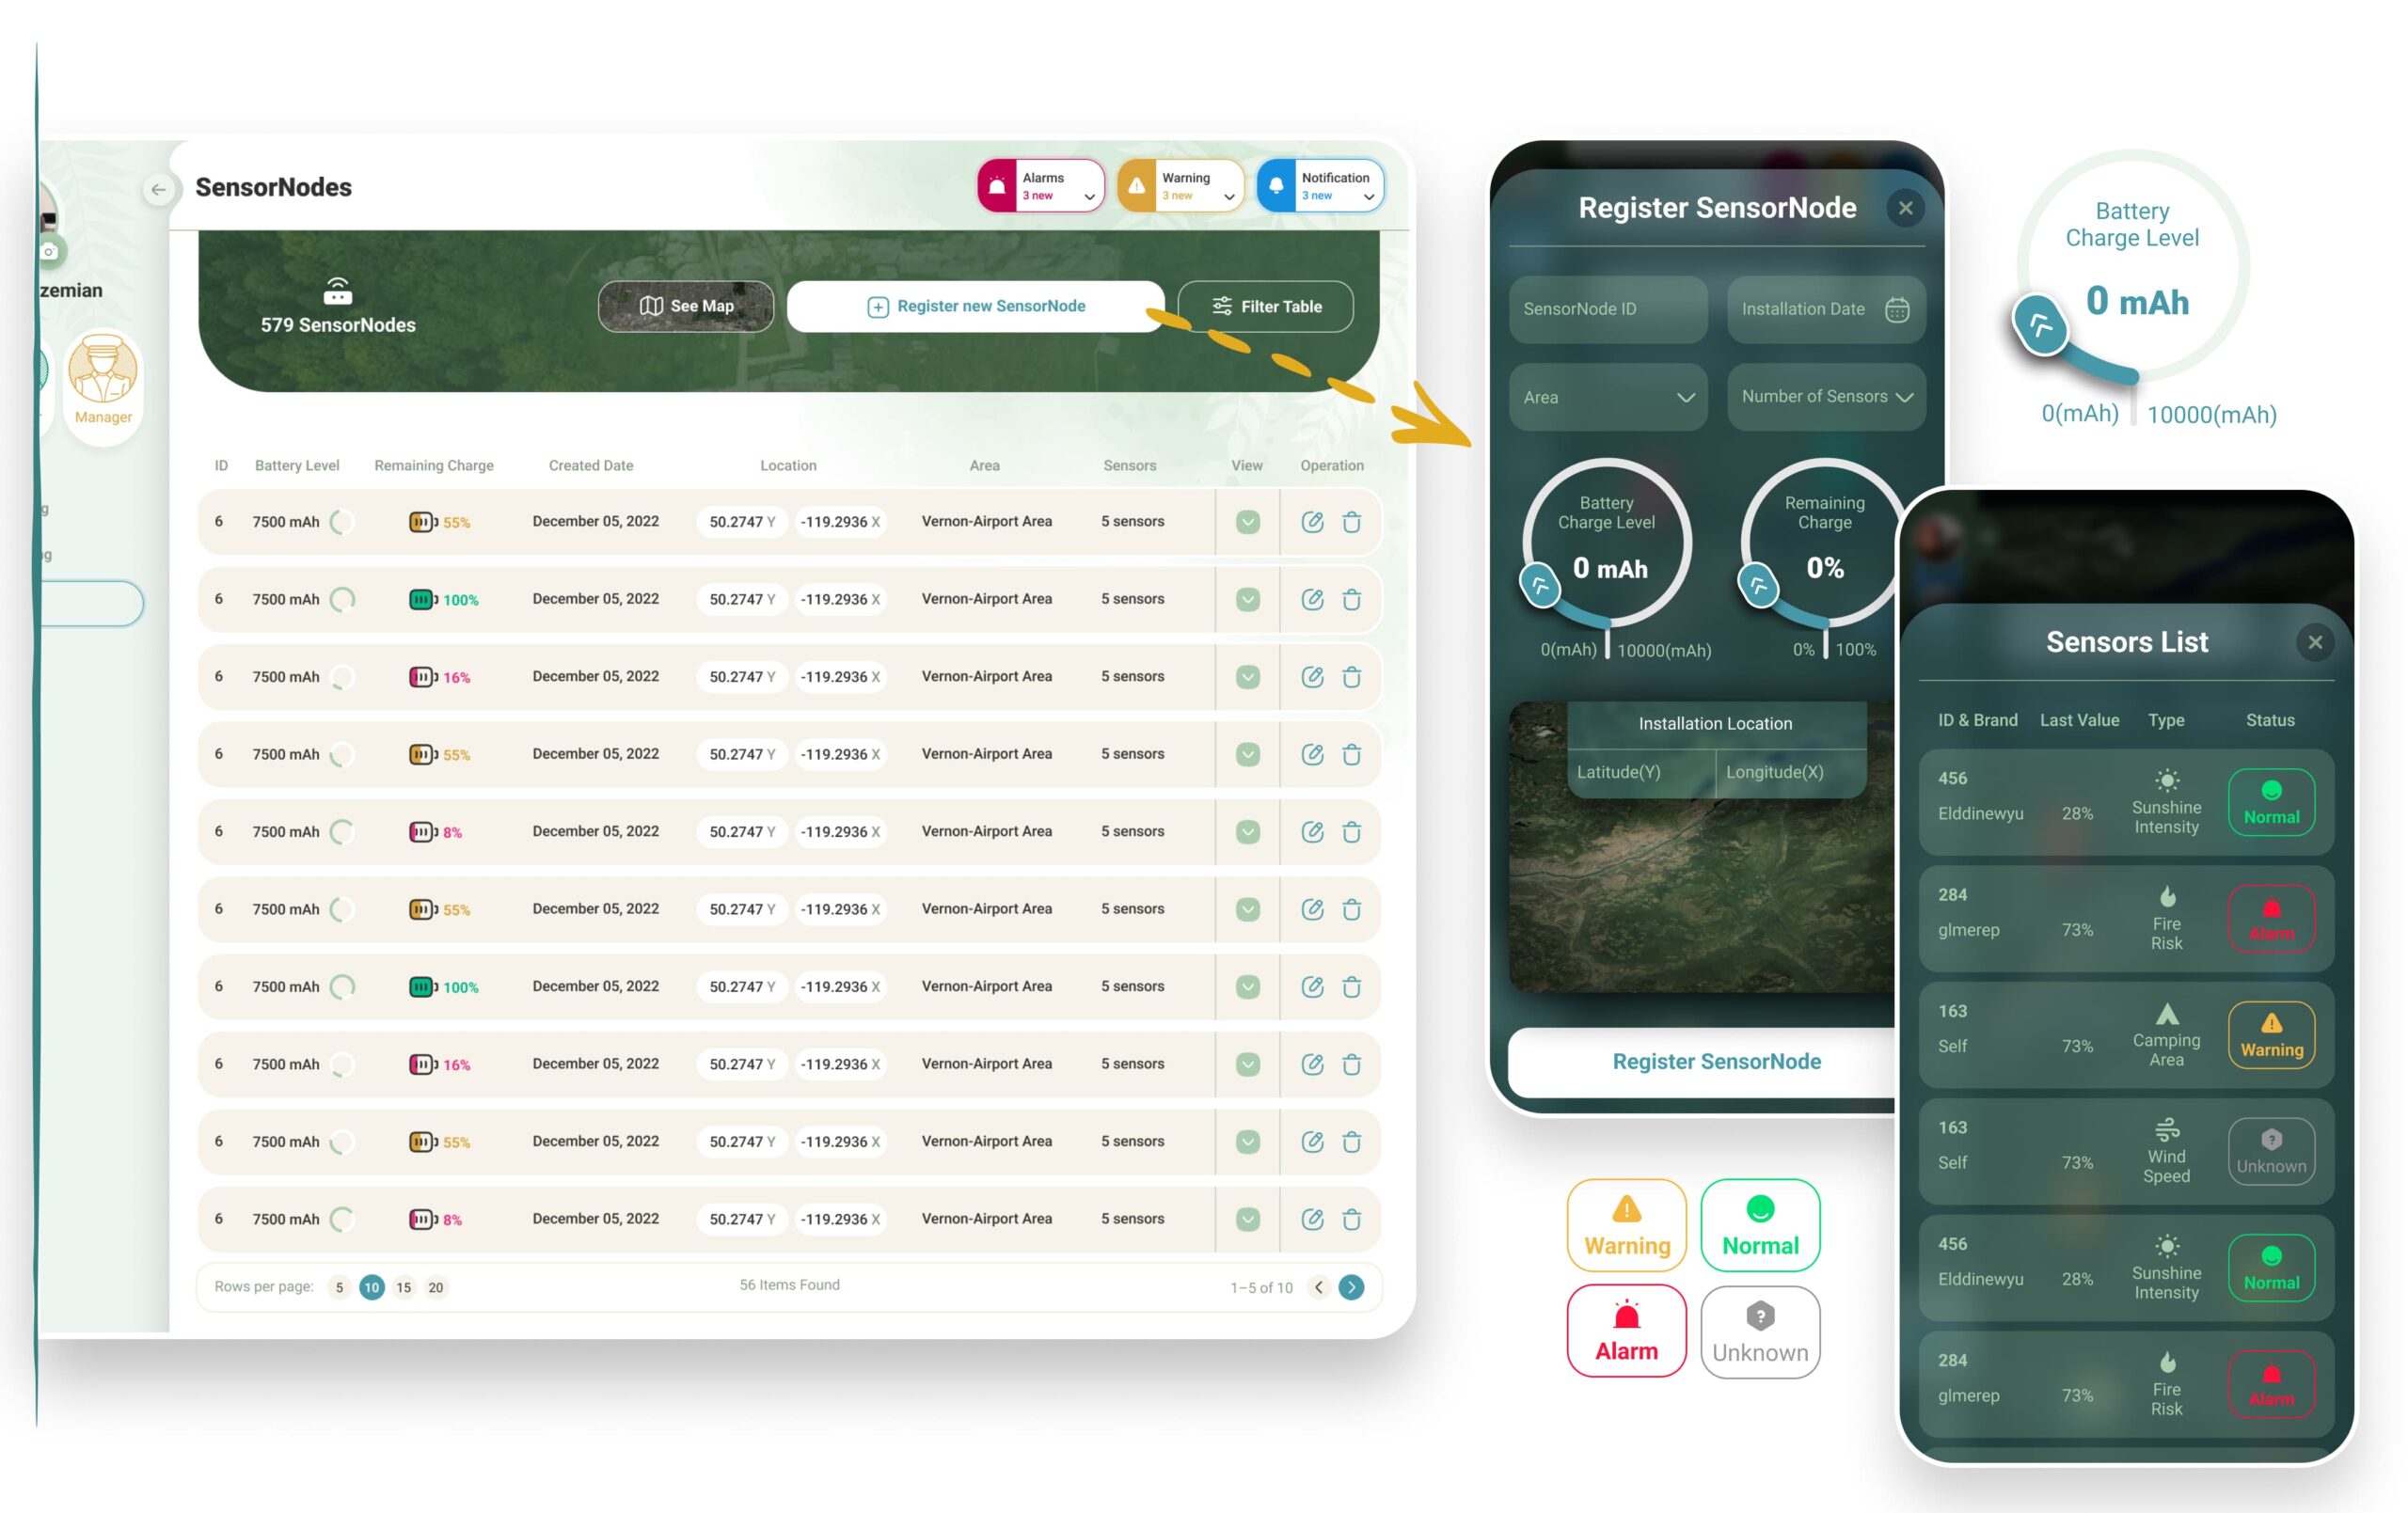
Track SensorNodes by Table or Map
Dual table and map views let users scan hundreds of SensorNodes or drill into details, with colors and icons supporting quick interpretation.
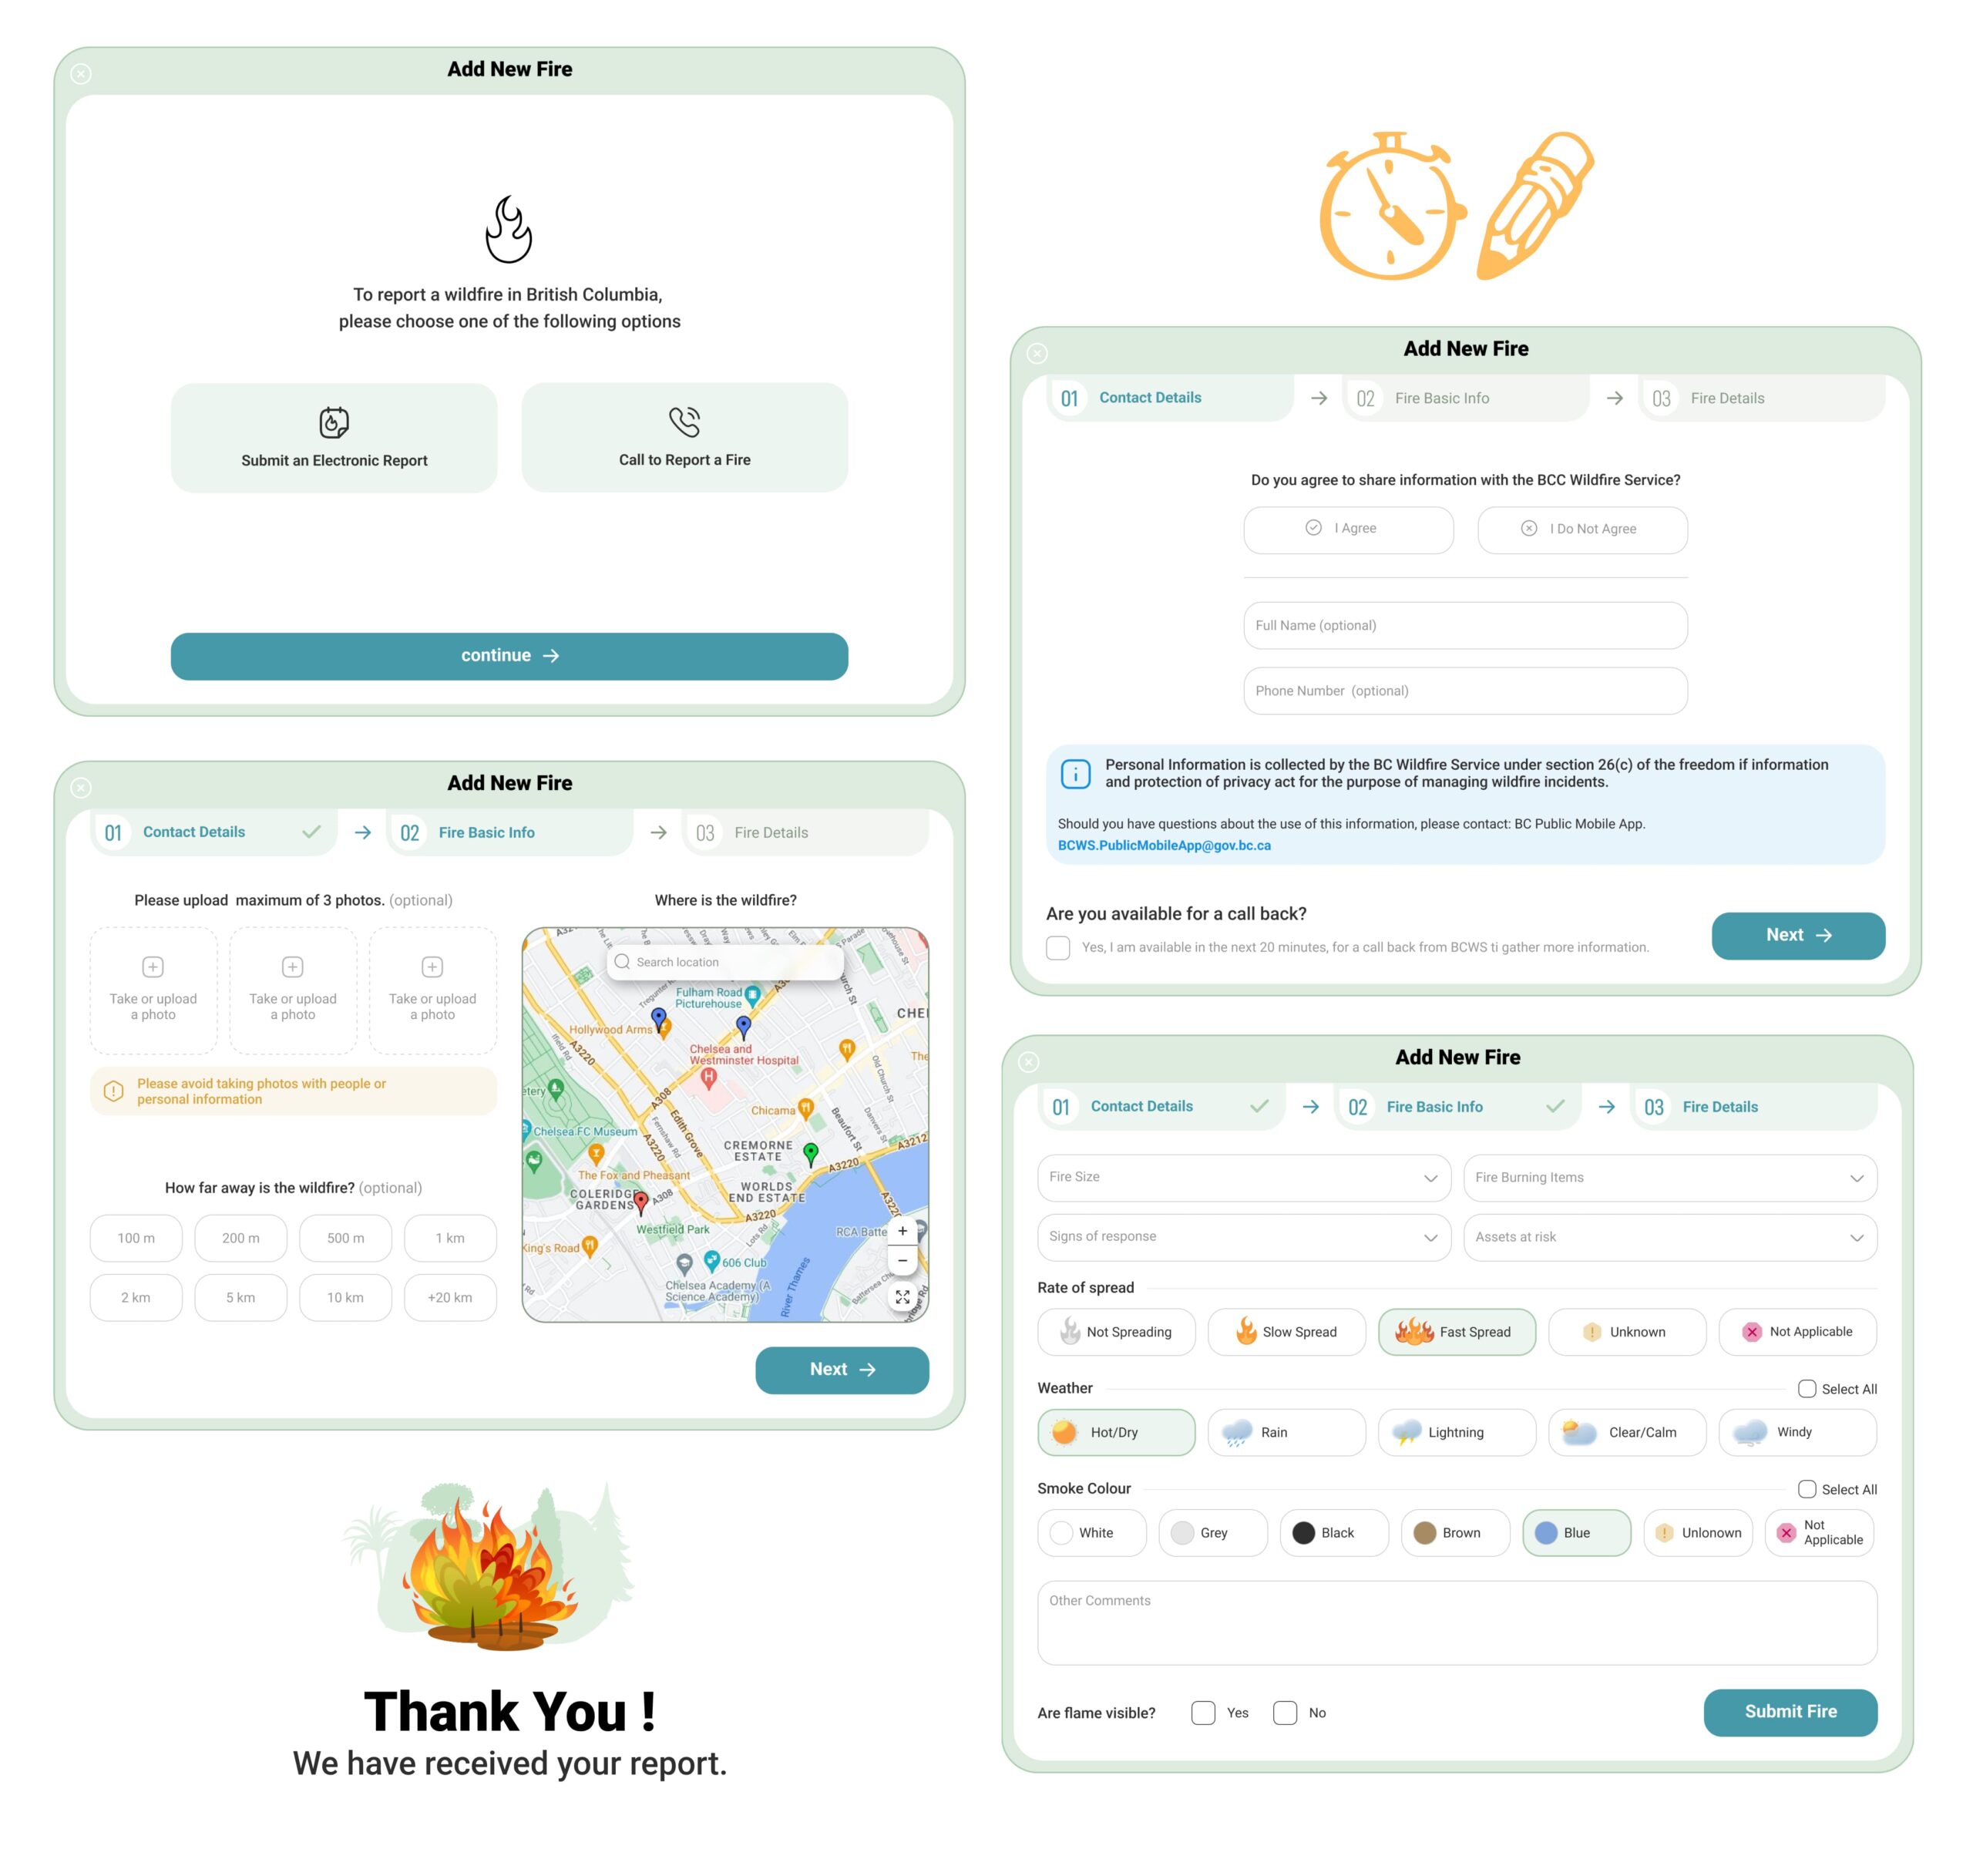
Report a Fire with Guided Steps
Step indicators and visual inputs replace heavy dropdowns, making wildfire reporting faster, lighter, and more intuitive.
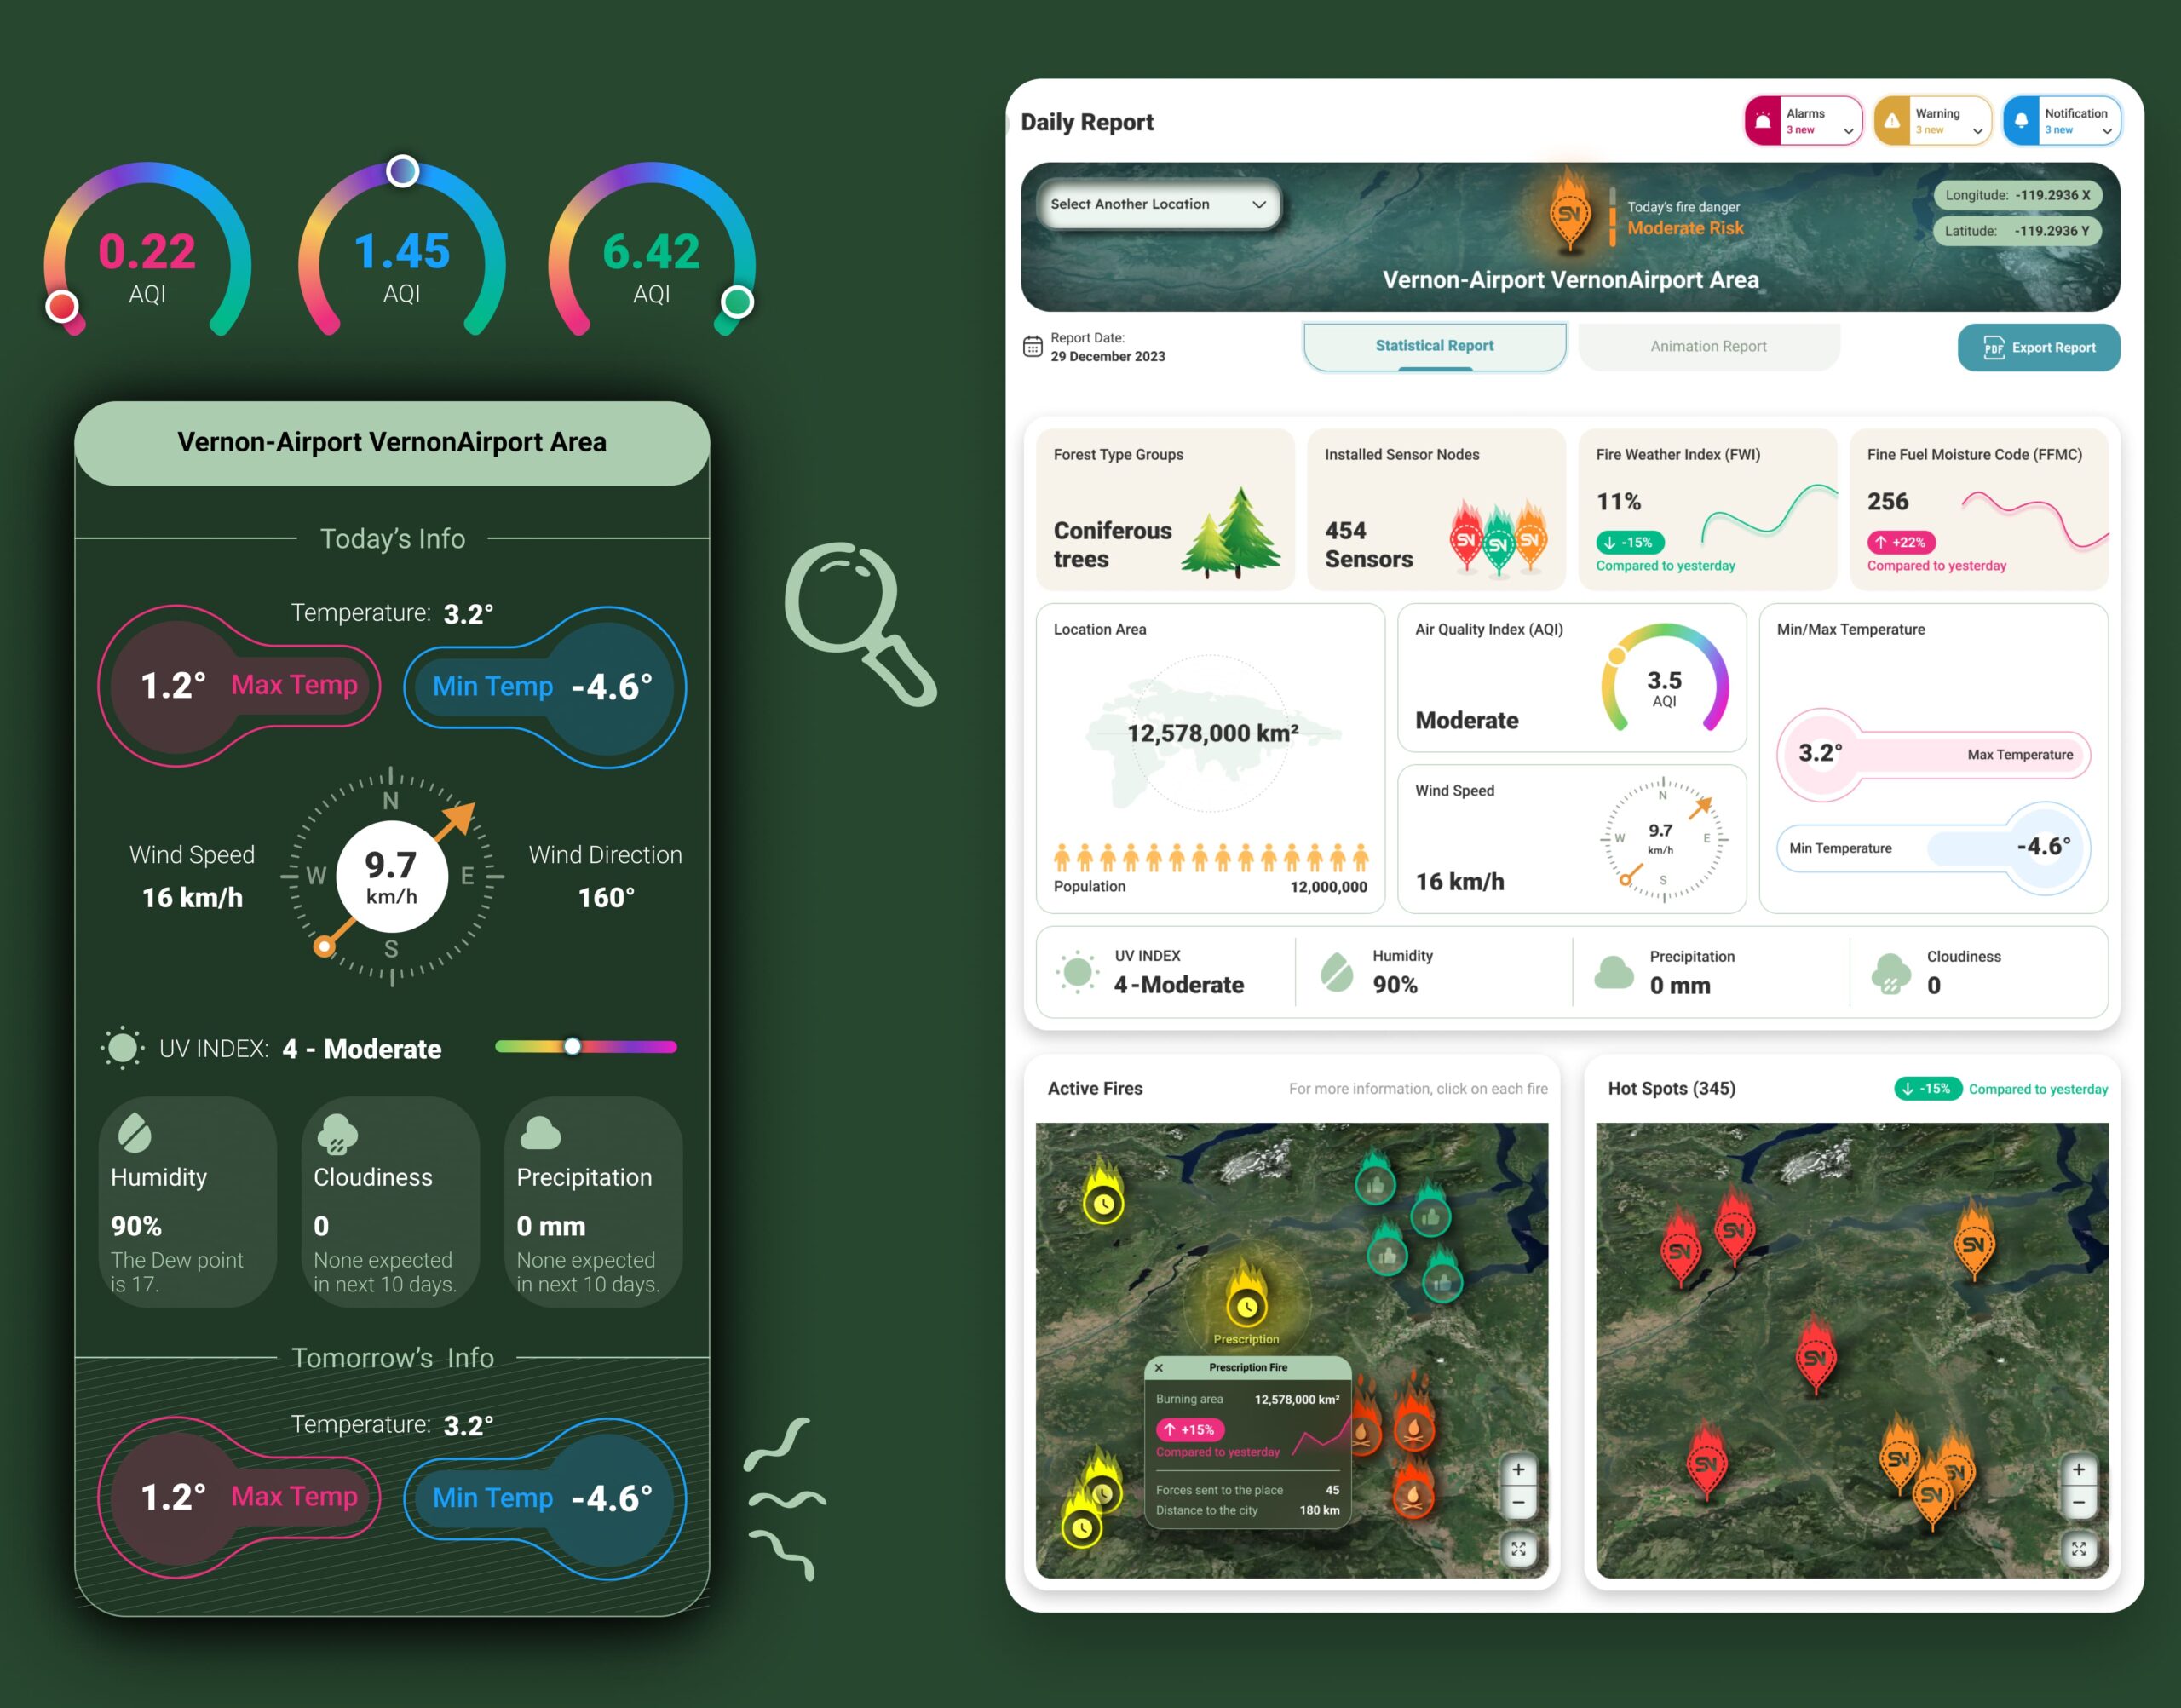
Dynamic Fire Reports for Deeper Insight
Interactive dashboards combine stats and visuals, letting users drill down by region or scan high-level wildfire data at a glance.
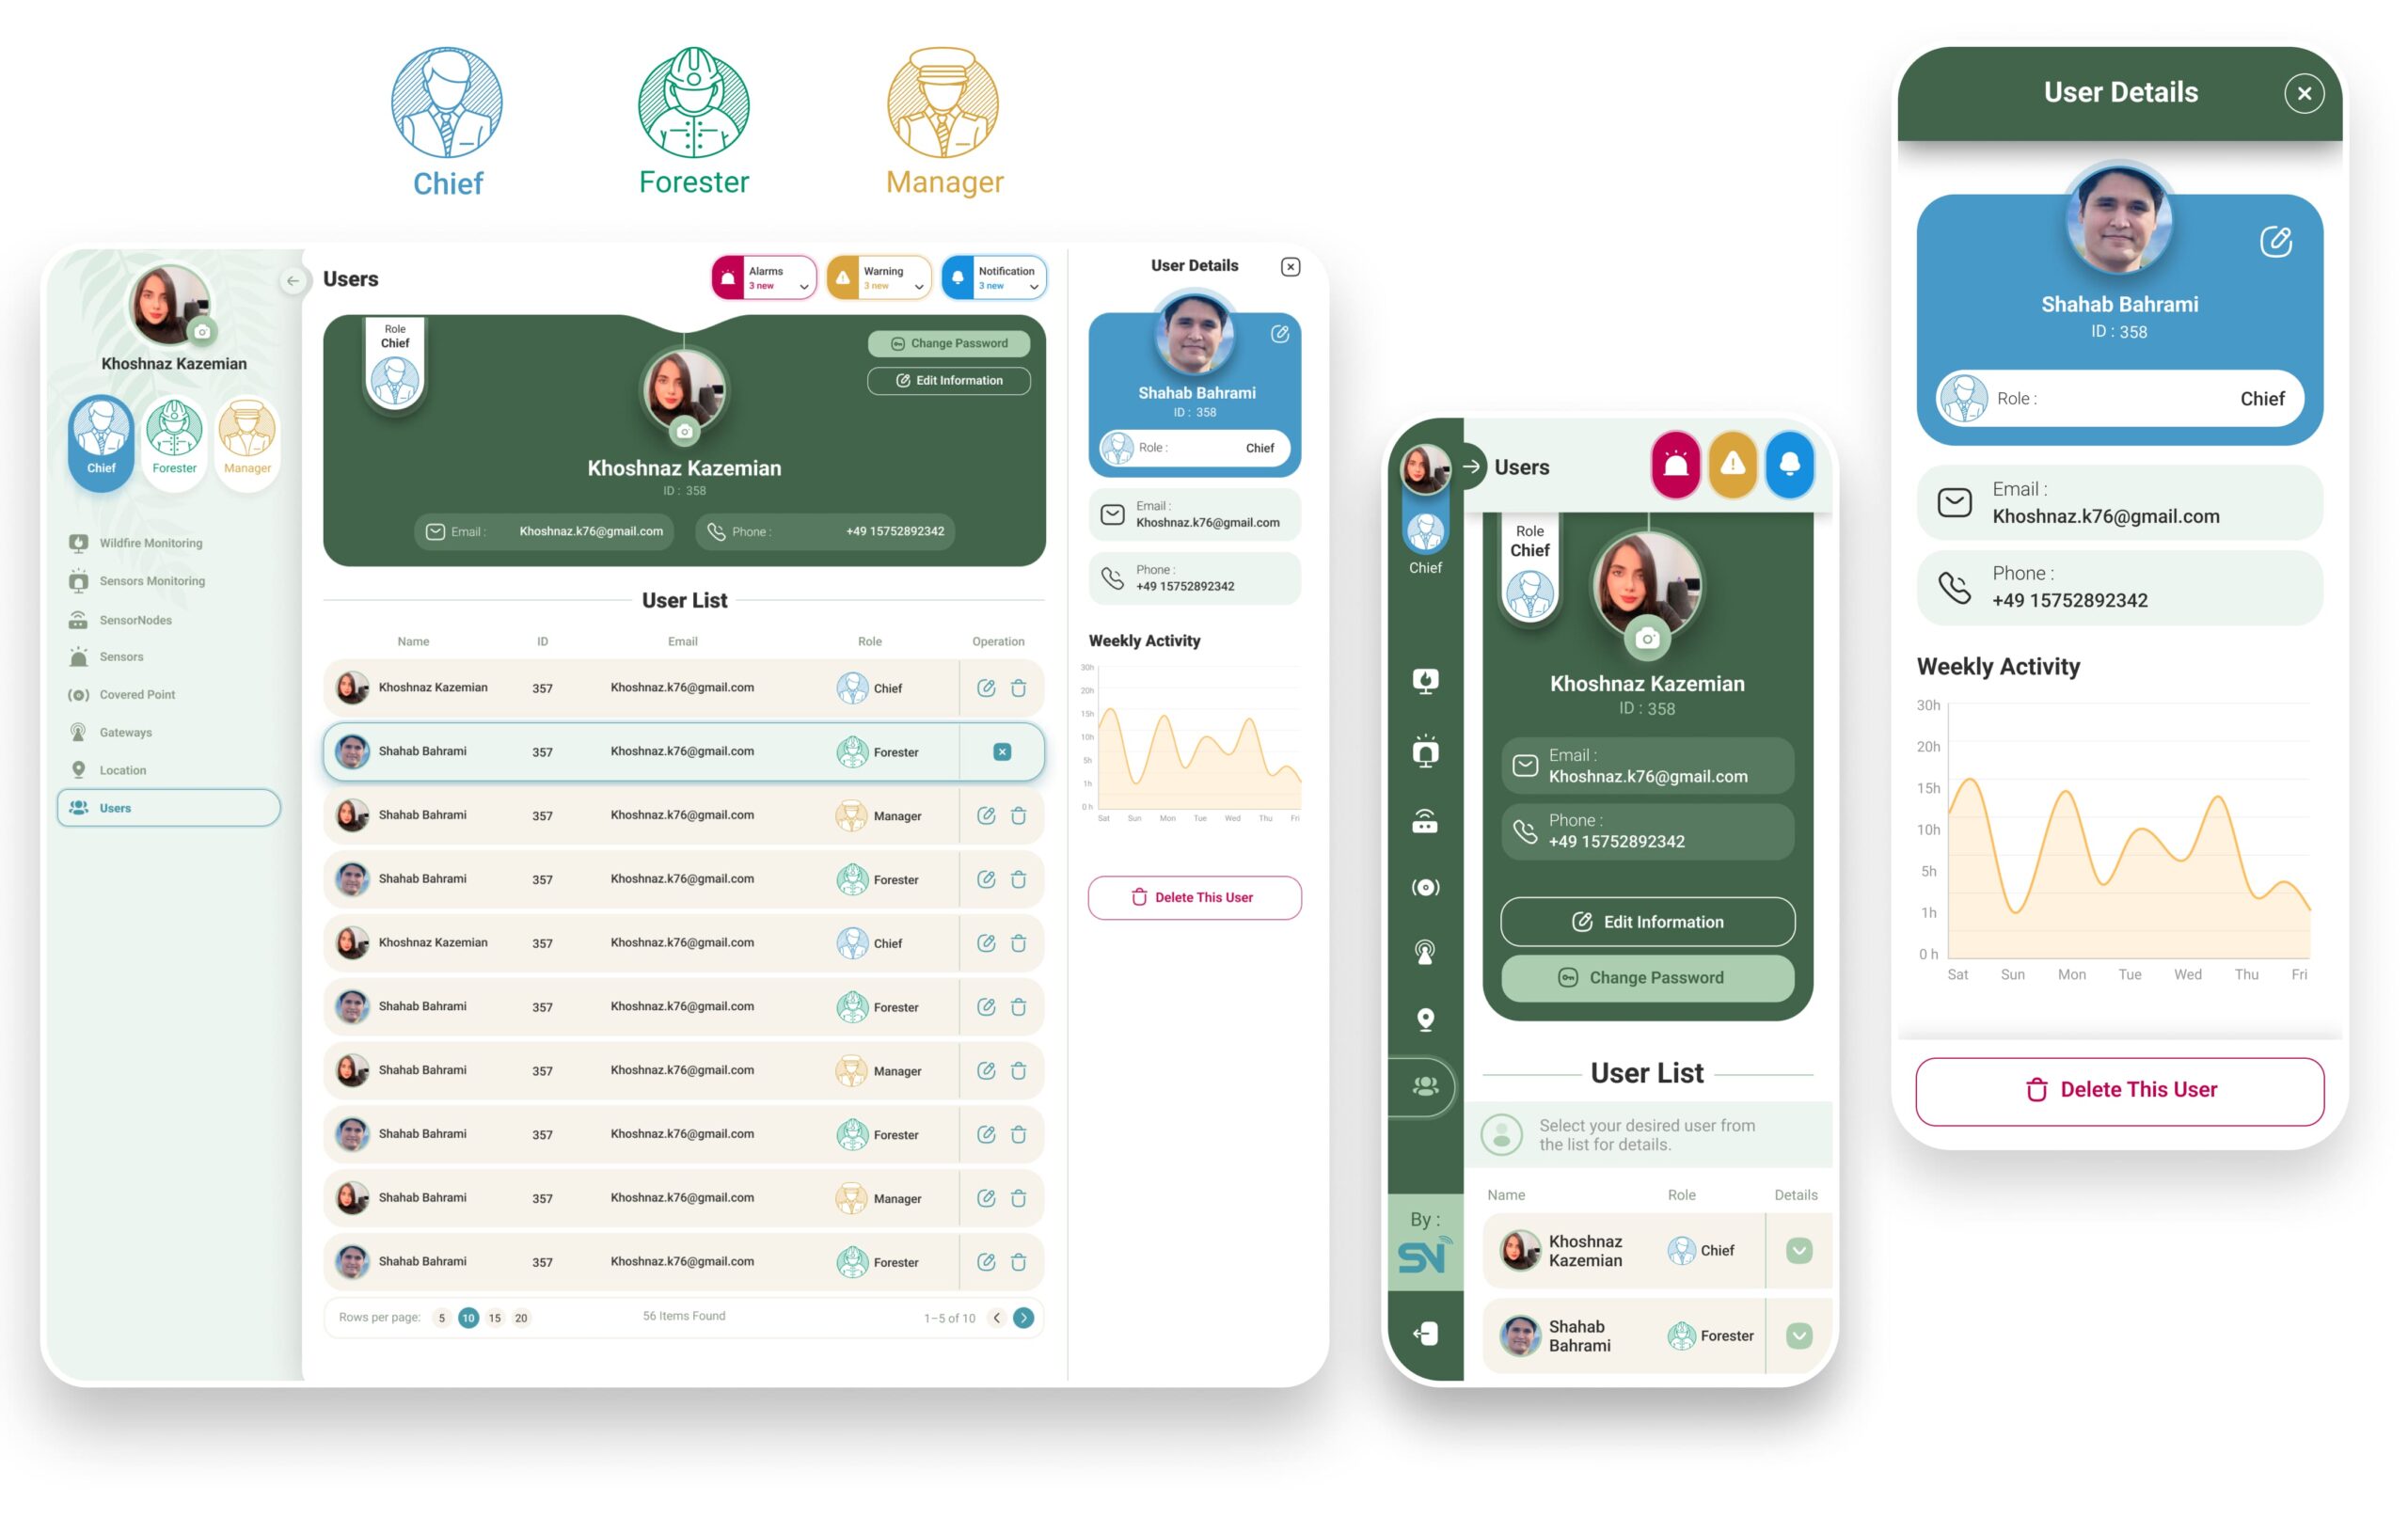
Flexible User Roles and Oversight
Admin tools manage roles, permissions, and activity tracking, supporting both field teams and operational staff with tailored access.
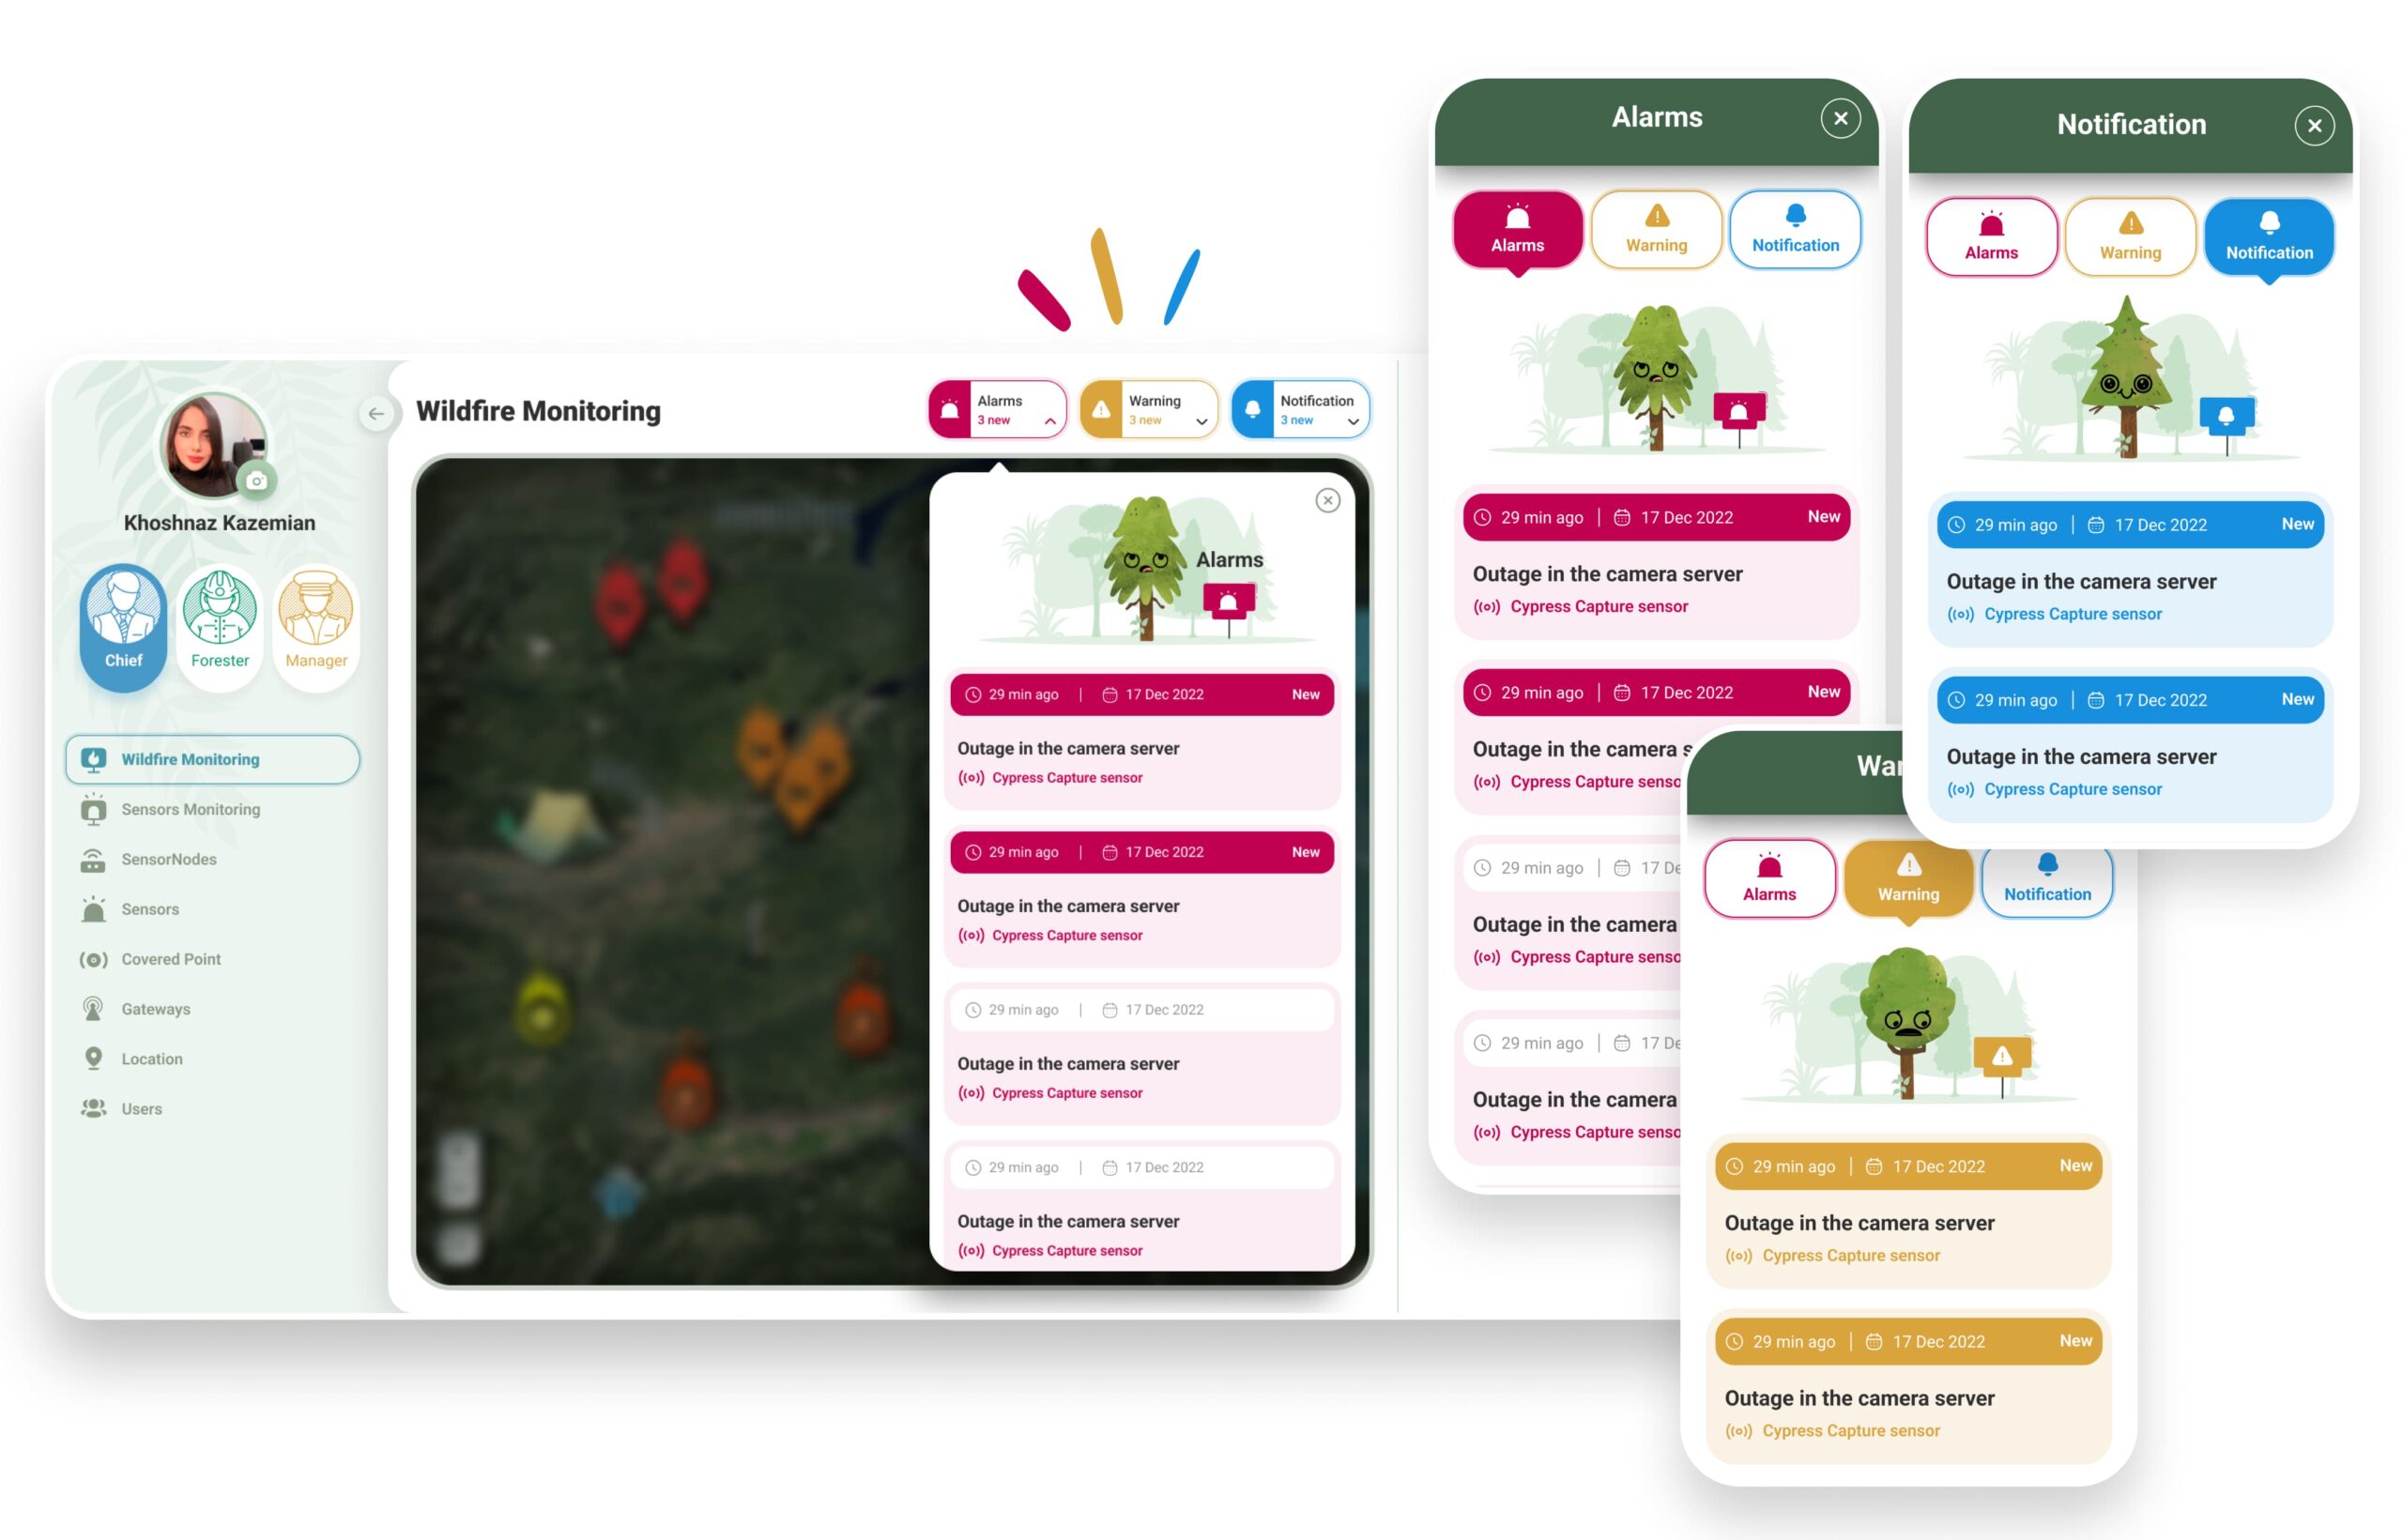
Prioritized Alarms at a Glance
Persistent headers keep alarms always visible, while severity-based categories help teams focus on critical issues first.
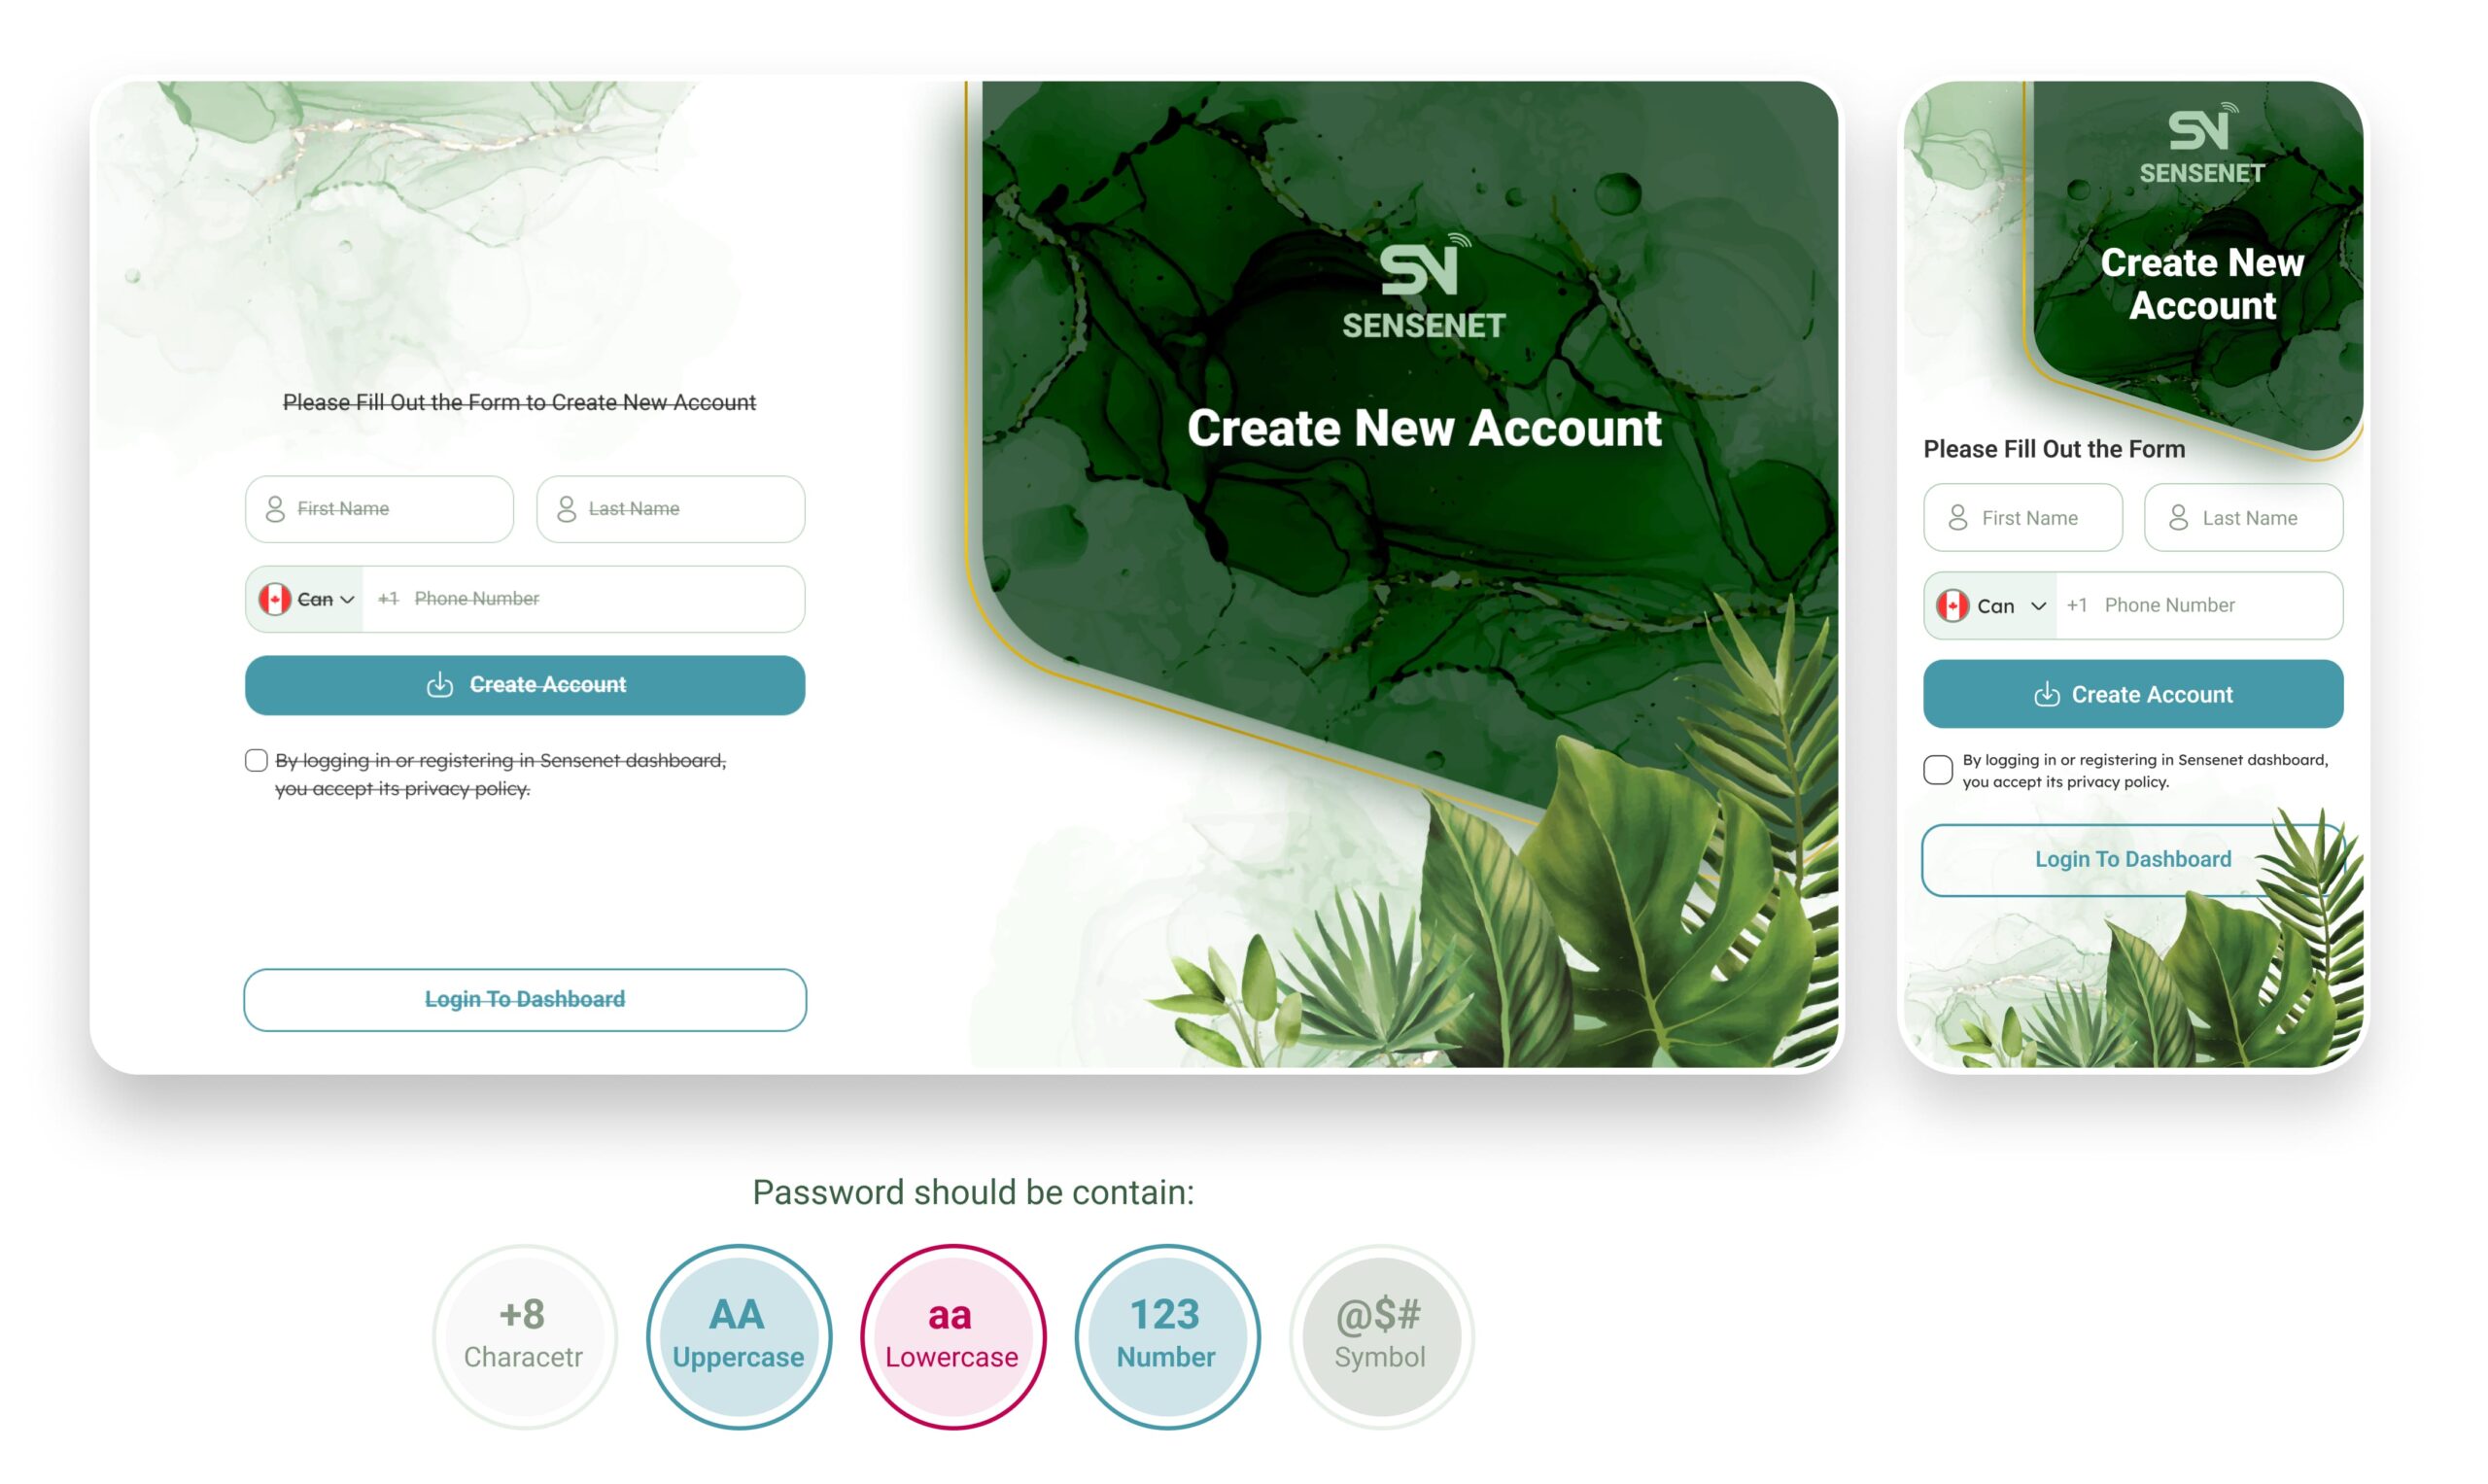
Branded Sign-In Experience
Visually rich onboarding flows with custom graphics create a distinct brand identity and differentiate the platform from generic sign-up forms.
Looking to purchase
Designer Assistance 01, 02, 03?
Please send me an email with your request, and I’ll provide you with instructions on how to buy the designer assistance files.